 |
||
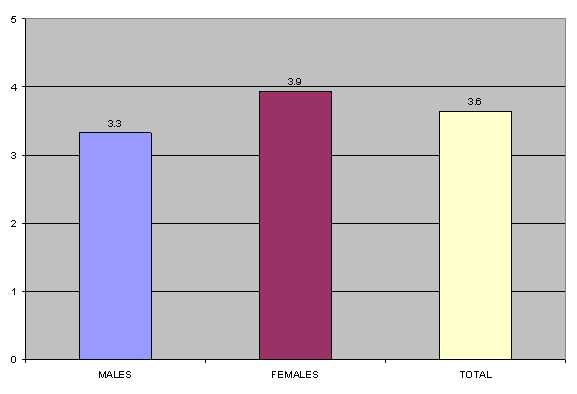
Physical and Mental HealthTimes Seen for Physical Health Problems Females were seen in the past year by a health professional for physical health problems slightly more often than males. Figure 8.1 presents the average number of times persons were seen by a health professional for physical health problems in the past 12 months. Figure 8.1: Average number of times seen for physical health problems in the past 12 months (question G11)
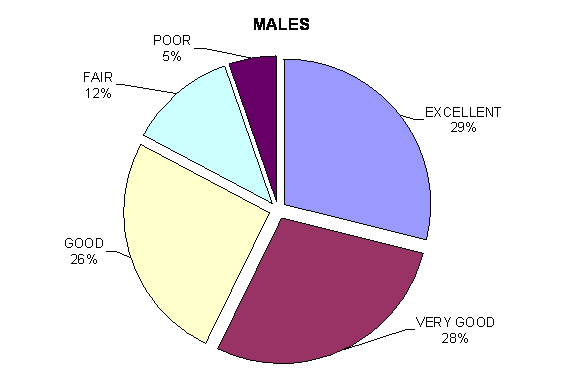
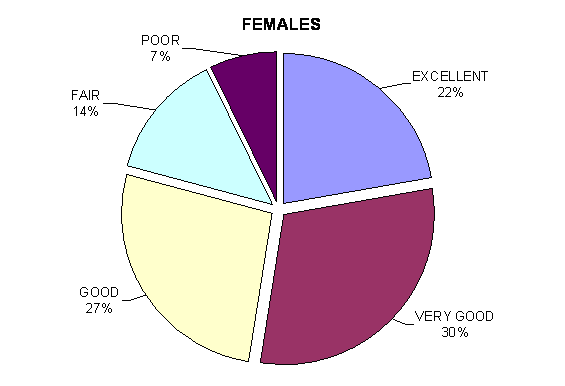
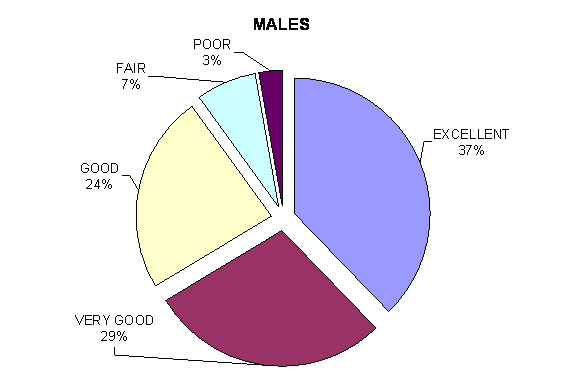
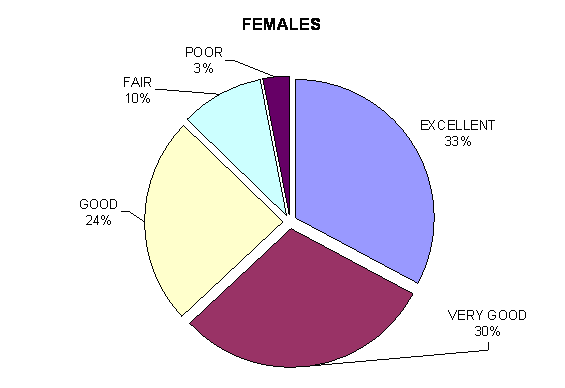
Physical Health Self-Rating Males generally rated their physical health higher than females. Figure 8.2 presents the distribution of physical health self-ratings by gender. Figure 8.2: Physical health self-ratings (question G11a)
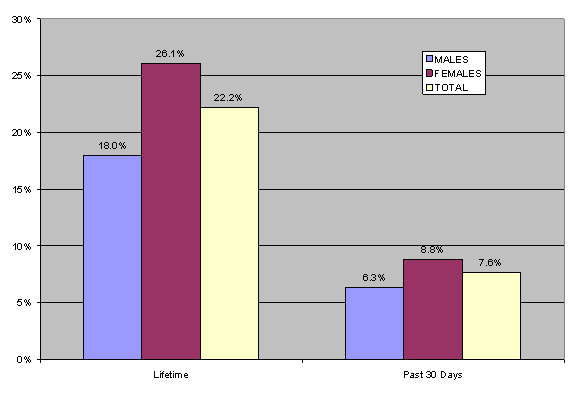
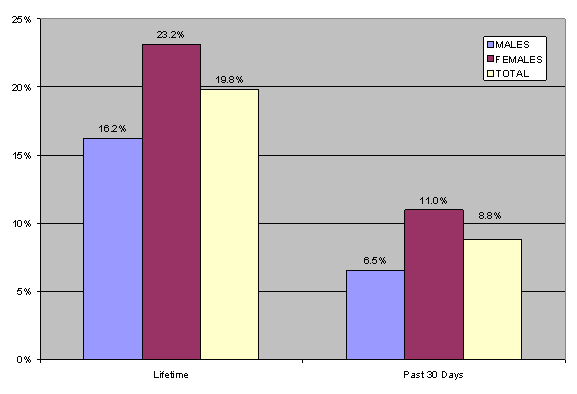
Depression Respondents were asked if they experienced a serious depression lasting for at least two weeks and not a direct result of drug/alcohol use. Females were more likely to report experiencing lifetime depression than males. Figure 8.3 presents the percent of persons who reported experiencing a serious depression in their lifetime and within the past 30 days. Table 8.1 presents the estimated number of adult Kentuckians who ever experienced serious depression. Figure 8.3: Percent of adults who ever experienced serious depression (question G12a)
Table 8.1: Estimated number of adult Kentuckians who ever experienced serious depression (question G12a)
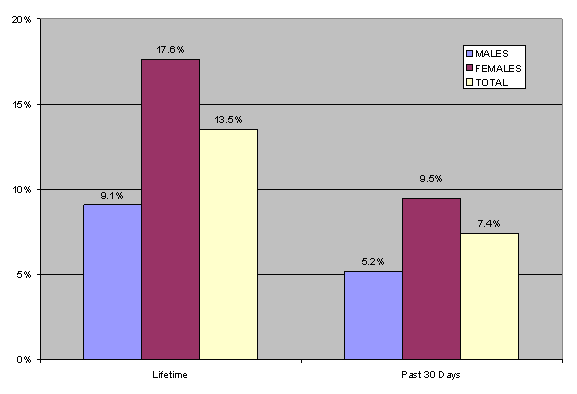
Anxiety/Tension - Respondents were asked if they experienced serious anxiety or tension lasting at least two weeks and not as a direct result of drug/alcohol use. Females were more likely to report experiencing lifetime and past 30 day anxiety/tension than males. Figure 8.4 presents the percent of persons who reported experiencing serious anxiety or tension in their lifetime and within the past 30 days. Table 8.2 presents the estimated number of adult Kentuckians who reported experiencing serious anxiety or tension. Figure 8.4: Percent of adults who ever experienced serious anxiety or tension (question G12b)
Table 8.2: Estimated number of adult Kentuckians who ever experienced serious anxiety or tension (question G12b)
Medications Respondents were asked if they had been prescribed any medication for psychological or emotional problems in the last 30 days, not including medications used for drug/alcohol treatment. Females were significantly more likely to report being prescribed a medication for psychological or emotional problems in their lifetime and within the past 30 days than males. Figure 8.5 presents the percent of persons who were prescribed a medication for a psychological or emotional problem in their lifetime and within the past 30 days. Table 8.3 presents the estimated number of adult Kentuckians who were prescribed a medication for psychological or emotional problems in their lifetime. Figure 8.5: Percent of adults who were ever prescribed medication for psychological or emotional problems (question G12c)
Table 8.3: Estimated number of adult Kentuckians who were ever prescribed a medication for psychological or emotional problems (question G12c)
Mental Health Self-Rating Males generally self-rated their mental health as better than females. Figure 8.6 presents the distribution of mental health self-ratings by gender. Figure 8.6: Mental health self-ratings (question G16)
Pregnancy 1.4% of female survey respondents reported they were pregnant and another 4.9% reported they were pregnant within the past year. Of those who reported they were pregnant at the time of the interview, 9.7% reported they used an illicit substance within the past 30 days. (questions H7, H8) HIV/AIDS Survey participants were asked to rate their chances of contracting HIV/AIDS. The majority (88.7%) indicated they had no chance of contracting the disease and only 1.8% of participants said they had a 50% or greater chance of contracting HIV/AIDS. There were no gender differences. African Americans were more likely to believe they had a 50% or greater chance of contracting HIV/AIDS than whites at 5.4% and 1.5% respectively. Persons aged 18 to 29 years old and persons aged 40 to 49 were more likely than other age groups to say they had a 50% or greater chance of contracting HIV/AIDS. Table 8.4 presents the percent of persons who believe they have a 50% or greater chance of contracting HIV/AIDS for selected groups. Table 8.4: Percent of adults who believe they have a 50% or greater chance of contracting HIV/AIDS (question G17)
e estimate too small to calculate accurately |
||||||||||||||||||||||||||||||||||||||||||||||||||||||||||||||||||||||||||||||||
2004 Report Section Quick Links
Executive Summary * Purpose, Objectives, & Methods * Demographics * Nicotine * Alcohol * Marijuana
Other Drugs * DSM-IV-TR Criteria * Treatment Utilization * Physical & Mental Health * Treatment Need
1999 Report Comparison * Regional Comparison * Jefferson & Fayette Counties * Concluding Remarks