 |
||
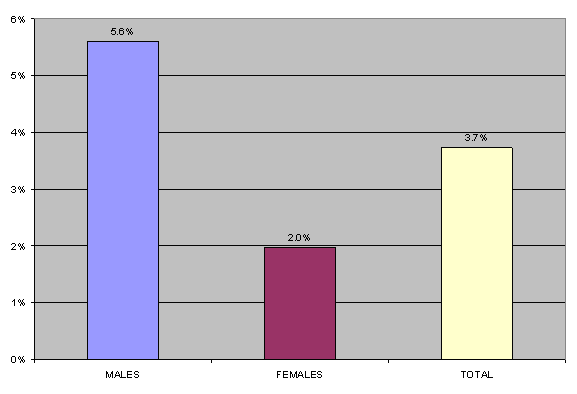
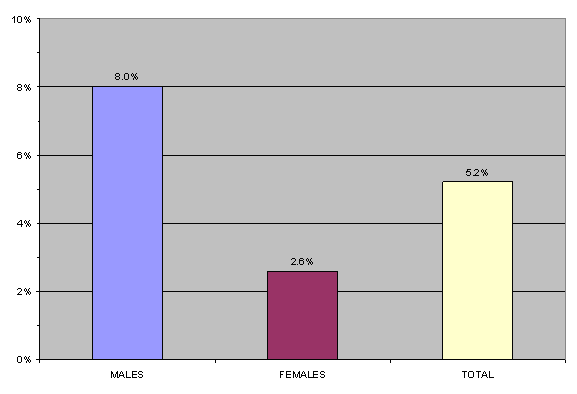
Treatment and Self-Help UtilizationTreatment/Counseling Males were more likely to receive treatment or counseling for drugs/alcohol than females. Treatment and counseling does not include attendance or participation in 12-step groups but includes detoxification services. Figure 7.1 presents the percentage of persons who have received treatment or counseling. More than twice as many males received treatment or counseling than females. Table 7.1 presents the estimated number of adult Kentuckians who received treatment or counseling. Figure 7.1: Percent of adults who ever received treatment or counseling for alcohol/drugs (question G2)
Table 7.1: Estimated number of adult Kentuckians who ever received treatment or counseling for alcohol/drugs (question G2)
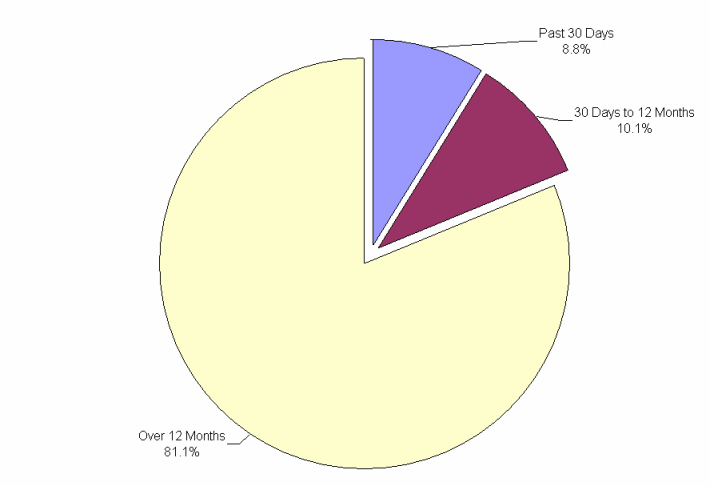
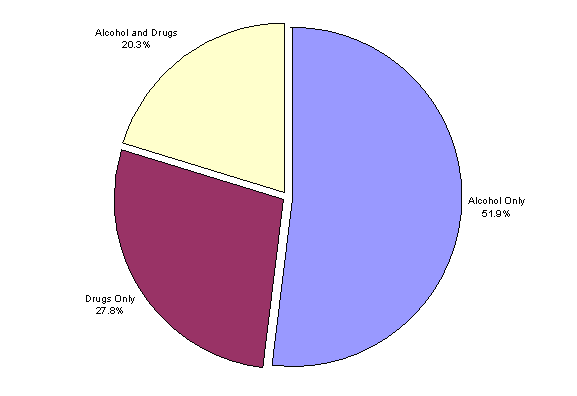
For those persons who participated in treatment or counseling for alcohol/drugs, over 80% of persons attended their last session over 12 months ago. Figure 7.2 presents the distribution of time since last treatment/counseling. Also for those who reported receiving treatment/counseling, about half of respondents received services for alcohol only. Figure 7.3 presents the distribution of primary reason for services. Figure 7.2: Time since last treatment or counseling for alcohol/drugs (question G2b)
Figure 7.3: Reason for treatment/counseling (question G4)
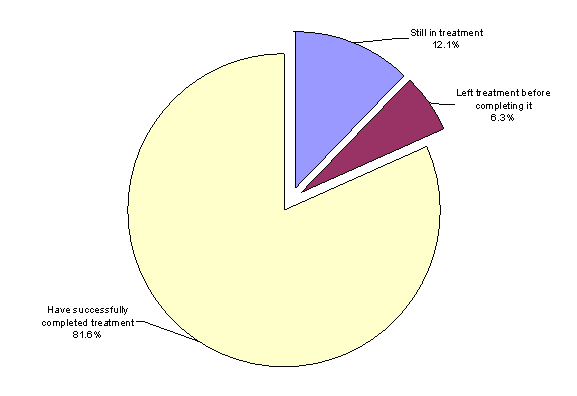
Of those who reported ever receiving treatment/counseling, over 80% successfully completed their most recent treatment. Figure 7.4 presents the distribution of how the most recent treatment concluded. For those who indicated that their last treatment ended early, respondents were asked why treatment ended early. 27.3% of persons who left treatment early stated it was due to problems with their treatment provider. 18.2% stated it was because they had resumed using drugs/alcohol. 9.1% stated they left treatment early because they could not afford it. Figure 7.4: How treatment concluded for the most recent treatment (question G5)
Payment of Services Of those who participated in alcohol/drug treatment or counseling, 34.2% of respondents reported that private health insurance paid for at least part of their services. 22.0% of respondents reported that Medicare or another public program funded all or part of their services. (question G6) Place of Treatment or Counseling The most common place respondents reported receiving their last treatment or counseling for alcohol/drugs was a residential facility. Table 7.2 presents the distribution of facilities where respondents reported receiving treatment or counseling. As noted above, treatment may include detoxification services. Table 7.2: Location where most recent treatment was received (question G3)
Self-Help Groups Subjects were asked if they have ever attended a 12-step group such as Alcoholics Anonymous or Narcotics Anonymous because they thought they might have a problem. Males were more likely to attend a 12-step meeting than females. Figure 7.5 presents the percentage of persons who reported ever attending a 12-step meeting. Table 7.3 presents the estimated number of Kentuckians who ever attended a 12-step meeting. Figure 7.5: Percentage of adults who ever attended a 12-step meeting (question G1)
Table 7.3: Estimated number of adult Kentuckians who ever attended a 12-step meeting (question G1)
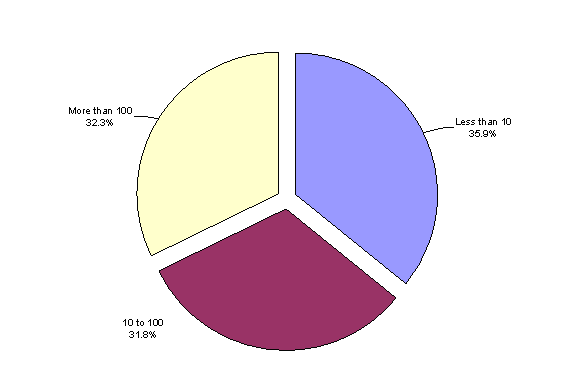
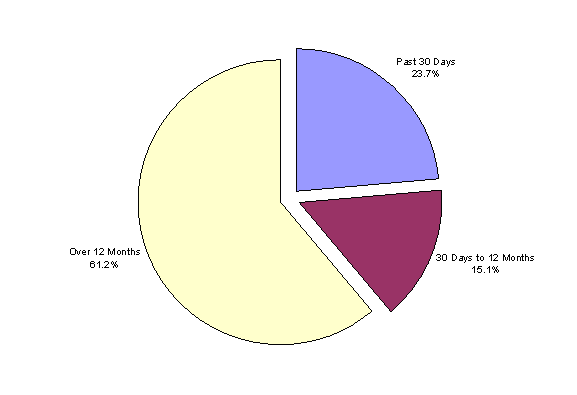
Of those who attended a 12-step meeting, about one third attended less than 10 total meetings, one third attended 10 to 100 meetings, and the remaining one third attended more than 100 meetings in their life. Figure 7.6 presents the distribution of 12-step meetings that persons attended. Of those ever attended a 12-step meeting, over half attended their last meeting over one year before. Figure 7.7 presents the distribution of participants last 12-step meeting. Figure 7.6: Number of 12-step meetings attended lifetime (question G1a)
Figure 7.7: Last 12-step meeting attended (question G1b)
|
2004 Report Section Quick Links
Executive Summary * Purpose, Objectives, & Methods * Demographics * Nicotine * Alcohol * Marijuana
Other Drugs * DSM-IV-TR Criteria * Treatment Utilization * Physical & Mental Health * Treatment Need
1999 Report Comparison * Regional Comparison * Jefferson & Fayette Counties * Concluding Remarks