 |
||
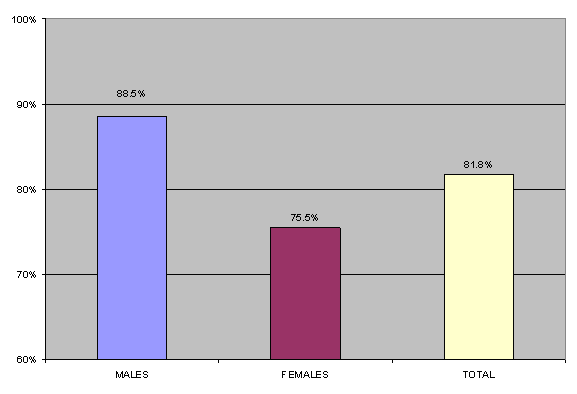
AlcoholAlcohol Use Significantly more adult males drank at least one alcoholic beverage in their lifetime than adult females. Figure 3.1 presents the percent of adult persons who drank at least one alcoholic beverage in their lifetime. Table 3.1 presents the estimated number of adult Kentuckians who drank at least one alcoholic beverage in their lifetime. Figure 3.1: Percent of adults who drank at least one alcoholic beverage in their life (question C1)
Table 3.1: Estimated number of adult Kentuckians who drank at least one alcoholic beverage in their lifetime (question C1)
Twelve Drinks in the Same Year Adult males were significantly more likely to drink 12 or more drinks in the same year than adult females. Figure 3.2 presents the percent of adults who reported drinking at least 12 drinks in a single year. Of those persons who reported alcohol use, 86.7% of males and 67.0% of females also reported drinking 12 or more alcoholic beverages in the same year. Table 3.2 presents the estimated number of adult Kentuckians who have drank at least 12 alcoholic beverages in the same year. Figure 3.2: Percent who drank at least 12 drinks in the same year (question C1a)
Table 3.2: Estimated number of adult Kentuckians who drank at least 12 alcoholic beverages in the same year (question C1a)
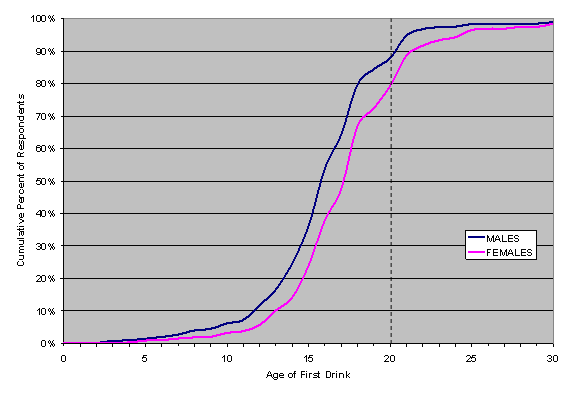
Age of First Drink Of those persons who reported drinking 12 or more alcoholic beverages in the same year, males tended to take their first drink at an earlier age than females. The average age of first drink for males was 16.5 years and 17.9 years of age for females. 87.9% of males and 79.3% of females reported having their first alcoholic beverage by age 20. Figure 3.3 presents the cumulative percent of persons by age of first drink. There were no significant differences in age of first drink between highest level of education attained. There were some minor racial differences. African Americans tended to experience their first alcoholic beverage later than other groups. Table 3.3 presents the average age of first drink by race. Figure 3.3: Cumulative percent of adults by age of first drink (question C2)
Table 3.3: Average age of first drink by race/ethnicity (question C2)
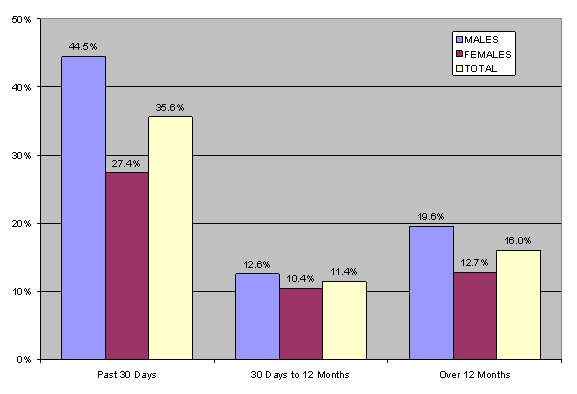
Last Use of Alcohol Of those persons who reported drinking at least 12 drinks in a single year, over half of respondents reported their last alcoholic beverage was within the past 30 days. For all adult Kentuckians, about 36% of persons surveyed reported drinking an alcoholic beverage within the past 30 days. Males were significantly more likely to drink an alcoholic beverage within the past 30 days than females. Figure 3.4 presents the distribution of reported last drink. Tables 3.4 and 3.5 present the estimated number of adult Kentuckians who have drank alcohol within the past year and past 30 days. Figure 3.4: Time since last alcohol for all adult Kentuckians (question C3)
Table 3.4: Estimated number of adult Kentuckians who drank alcohol within the past year (question C3)
Table 3.5: Estimated number of adult Kentuckians who drank alcohol within the past 30 days (question C3)
Frequency of Drinking Of those persons who reported drinking more than 12 alcoholic beverages in the same year and drinking alcohol within the past 30 days, the average number of days alcohol was used over the past month was 9.8 days for males and 5.3 days for females. For those persons who reported drinking within the past 30 days, 51.5% of males reported drinking an average of 4 or fewer days per month and 52.2% of females report drinking an average of 2 or fewer days per month. Additionally, of persons who reported drinking within the past month, 14.6% of males and 3.9% of females reported they drank at least one alcoholic beverage every day. For all Kentucky adults, 11.0% of males and 1.9% of females report daily alcohol intake. Table 3.6 presents the estimated number of adult Kentuckians who reported consuming at least one alcoholic beverage every day. Of those persons who reported daily drinking, 48.4% of males average 4 drinks or fewer per day and 71.7% of females report drinking 3 or fewer drinks per day. Table 3.6 Estimated number of adult Kentuckians who drank at least one alcoholic beverage every day in the past month (question C4)
Binge Drinking Binge drinking is defined as 5 or more drinks on one occasion for males and 4 or more drinks on one occasion for females. For persons who reported consuming 12 drinks or more in the same year, 84.1% of males reported consuming 5 or more drinks on one occasion and 76.1% of females reported consuming 4 or more drinks on one occasion. Table 3.7 presents the estimated number of adult Kentuckians who reported at least one binge drinking episode in their life time. Table 3.7: Estimated number of adult Kentuckians who reported at least one binge drinking episode in their life (question C6)
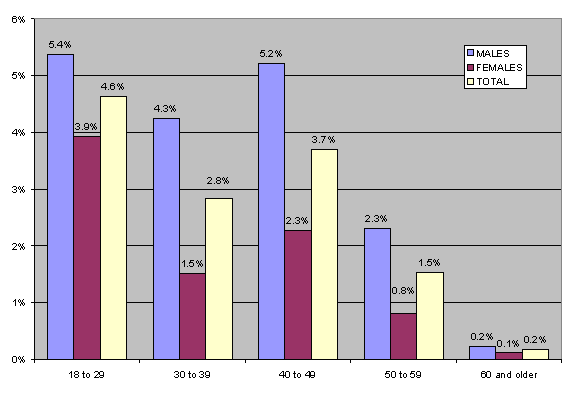
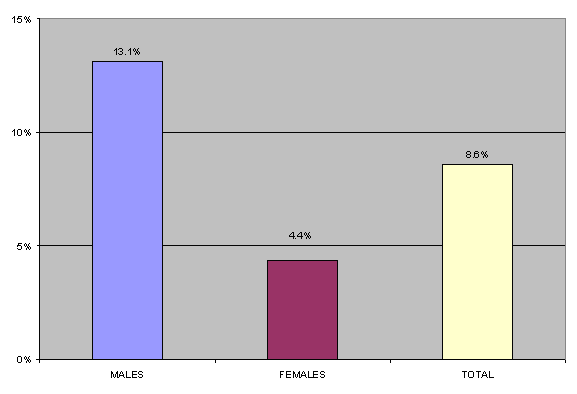
Alcohol in Combination with Other Drugs Of persons who had more than 12 drinks during a one year period, 22.7% of males and 17.2% of females reported using alcohol in combination with another drug (other than tobacco). For those who drank at least 12 drinks in a one year period, younger persons were generally more likely to have used alcohol with other drugs than older persons. Persons over 60 years of age were significantly less likely to have used alcohol with other drugs than all other age groups. Females over 30 years of age were less likely to have used alcohol with other drugs than females 18 to 29 years old. Males over 50 years of age were less likely to have used alcohol with other drugs than males 18 to 49 years old. Significant gender differences were found for the 30 to 39, 40 to 49, and 50 to 59 age groups. For these age groups, females were significantly less likely to have used alcohol in combination with other drugs than males. Figure 3.5 presents the percent of adult Kentuckians who drank at least 12 alcoholic beverages in a single year and who reported using alcohol in combination with other drugs in their lifetime. Figure 3.5: Percent of adults who used alcohol in combination with other drugs (excluding tobacco) by age range (question C8)
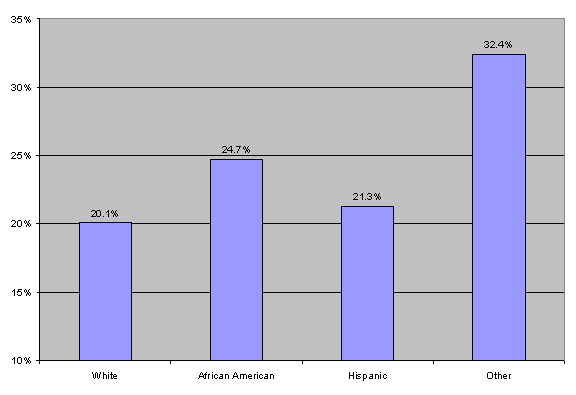
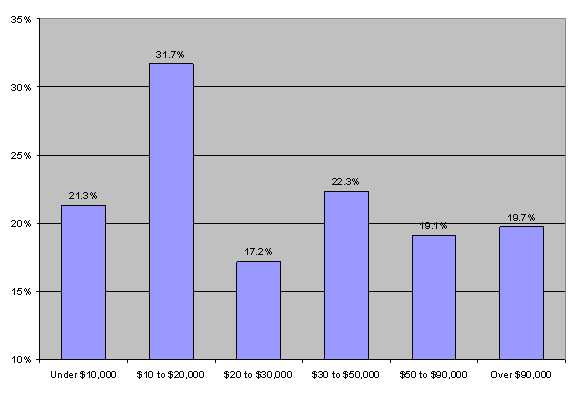
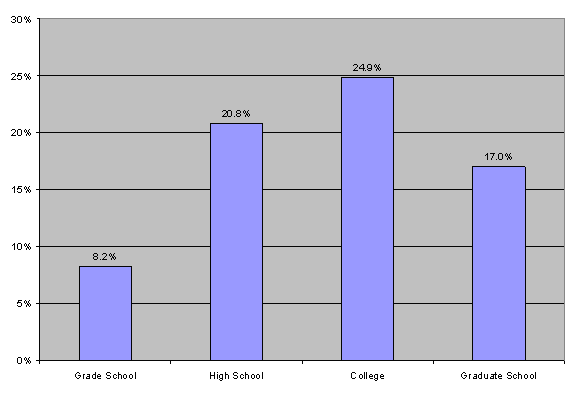
For persons who drank at least 12 alcoholic beverages in the same year, there were no significant differences between races, household income, or school completed for persons reporting using alcohol with other drugs excluding tobacco. Figure 3.6 presents the percent of persons who drank at least 12 alcoholic beverages in a single year and who reported ever using alcohol in combination with other drugs by race. Figure 3.7 presents the percent of persons who drank at least 12 alcoholic beverages in one year and who reported ever using alcohol in combination with other drugs by household income. Figure 3.8 presents the percent of persons who drank at least 12 alcoholic beverages in a single year and who reported ever using alcohol in combination with other drugs by highest level of education attained. Figure 3.6: Percent of adults who used alcohol in combination with other drugs (excluding tobacco) by race (question C8)
Figure 3.7: Percent of adults who used alcohol in combination with other drugs (excluding tobacco) by household income levels (question C8)
Figure 3.8: Percent of adults who used alcohol in combination with other drugs (excluding tobacco) by highest education attained (question C8)
Thought Alcohol a Problem Of all persons in Kentucky , adult males reported that they thought alcohol was a problem at some point in their life significantly more than adult females. Figure 3.9 presents the percent of persons who ever thought that alcohol was a problem in their life. Of those persons who reported drinking every day in the past month, 38.1% reported that alcohol was a problem at some point in their life. Table 3.8 presents the estimated number of all adult Kentuckians who believe that alcohol was a problem at some point in their life. Figure 3.9: Percent of adults who thought alcohol was a problem at some point in their life (question C9)
Table 3.8: Estimated number of adult Kentuckians who believe that alcohol has ever been a problem in their life (question C9)
|

2004 Report Section Quick Links
Executive Summary * Purpose, Objectives, & Methods * Demographics * Nicotine * Alcohol * Marijuana
Other Drugs * DSM-IV-TR Criteria * Treatment Utilization * Physical & Mental Health * Treatment Need
1999 Report Comparison * Regional Comparison * Jefferson & Fayette Counties * Concluding Remarks