 |
||
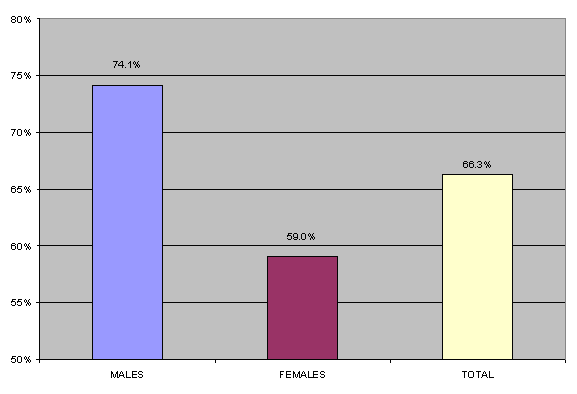
NicotineEver Smoked The percent of Kentuckians aged 18 years or older who reported ever smoking all or part of a cigarette is higher for males than females. Figure 2.1 presents the percent who reported ever smoking all or part of a cigarette. Table 2.1 presents the estimated number of adult Kentuckians who smoked all or part of a cigarette. Figure 2.1: Percent of adults who ever smoked all or part of a cigarette (question B1)
Table 2.1: Estimated number of adult Kentuckians who reported ever smoking all or part of a cigarette (question B1)
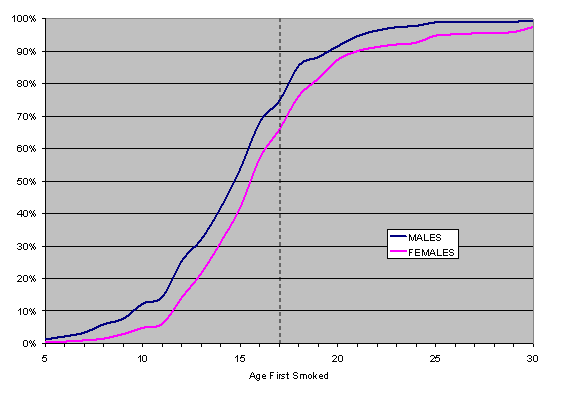
Age of First Cigarette Of persons who reported ever smoking all or part of a cigarette, males tend to begin smoking at an earlier age than females. 74.8% of males and 66.0% of females report their first cigarette at age 17 or younger. The average age of first cigarette use was 15.2 for males and 16.8 for females. Approximately 10% of males who ever smoked reported smoking their first cigarette by 10 years of age. Figure 2.2 presents the cumulative percent of the age of first cigarette by gender. Figure 2.2: Age of first cigarette use (question B2)
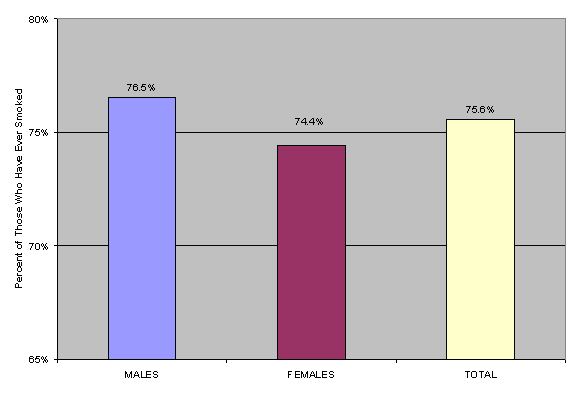
Smoked 100 or More Of those who smoked all or part of a cigarette in their lifetime, approximately the same percent of males smoked at least 100 cigarettes as females. Of persons who have ever smoked all or part of a cigarette, figure 2.3 presents the percent who smoked at least 100 cigarettes. Table 2.2 presents the estimated number of adult Kentuckians who smoked at least 100 cigarettes in their lifetime. Figure 2.3: Percent of adults who smoked at least 100 cigarettes (question B2a)
Table 2.2: Estimated number of adult Kentuckians who smoked at least 100 cigarettes (question B2a)
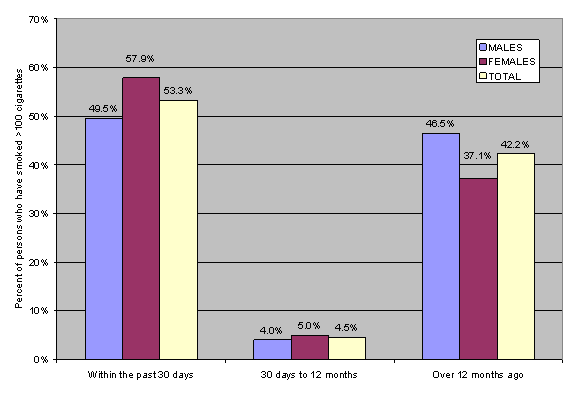
Time Since Last Smoked Of those persons who smoked all or part of a cigarette and smoked at least 100 cigarettes in their lifetime, the percent of persons who smoked within the past 30 days is slightly higher than the percentage of persons who did not smoke in over 12 months. Very few persons in this group smoked within the past year but not smoke within the last 30 days. Figure 2.4 presents the distribution of when persons last smoked. Table 2.3 presents the estimated number of adult Kentuckians who smoked within the past 30 days. For those who smoked in the past 30 days, between 85% and 90% smoked every day. Table 2.4 presents the estimated number of adult Kentuckians who currently smoke daily. Figure 2.4: Time since last cigarette use (question B3)
Table 2.3: Estimated number of adult Kentuckians who smoked cigarettes within the past 30 days (question B3)
Table 2.4: Estimated number of adult Kentuckians who smoke cigarettes daily (question B4)
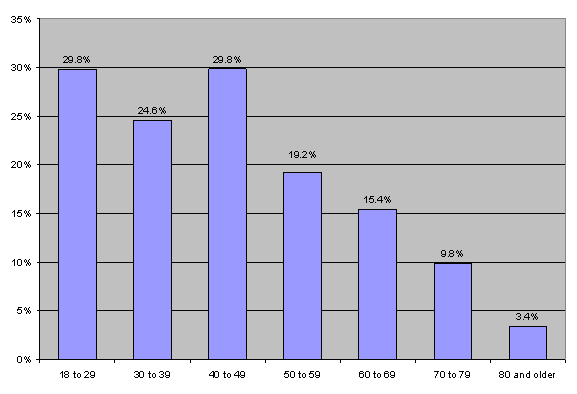
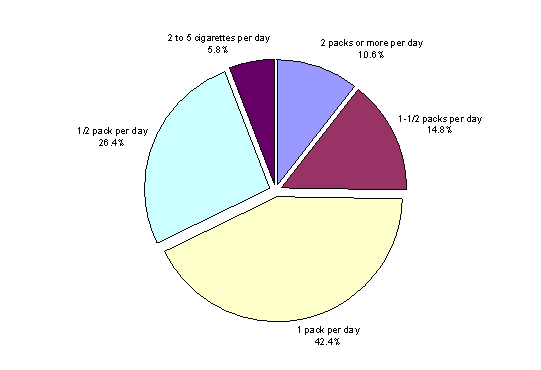
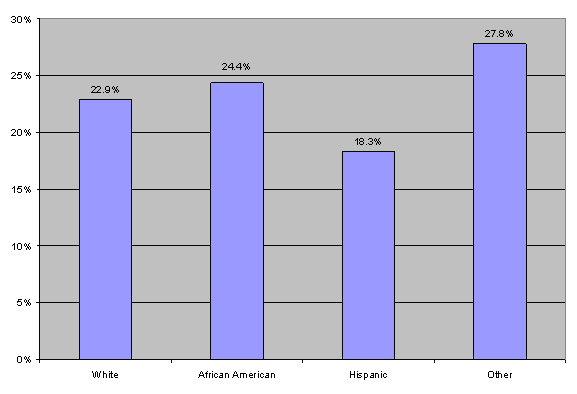
Daily Cigarette Use - For those persons who reported smoking every day in the past month, there was a trend for younger persons to be more likely to smoke daily than older persons. Figure 2.5 presents the percent of each age group that reported daily smoking in the past month. The majority of persons smoking every day report smoking at least 1 pack per day. Figure 2.6 presents the average number of cigarettes smoked per day by those who reported daily smoking. There were some minor differences in the percent of persons who reported smoking every day by race. Figure 2.7 presents the percent of daily smokers by race. Figure 2.5: Percent of age group that smoked cigarettes every day over the past month (question B4)
Figure 2.6: Average number of cigarettes smoked per day reported by adults who smoked every day over the past month (question B5)
Figure 2.7: Percent of adults who reported smoked cigarettes every day over the past month by race (question B5)
The percent of persons who reported cigarette smoking daily was lower for persons who reported higher household incomes. Persons who reported a household income of $90,000 or more for the previous year were significantly less likely to smoke daily than all other income ranges. Figure 2.8 presents the percent of persons who reported daily smoking by household income range. Figure 2.8: Percent of adults who smoke cigarettes daily by household income range (question B5)
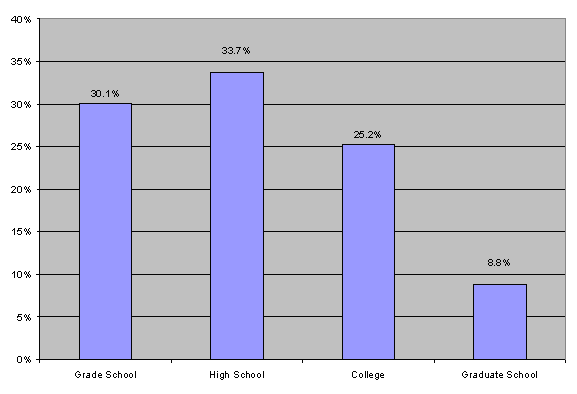
The percent of persons who reported daily smoking over the past month was generally lower for persons with more education. Persons who attended or completed graduate school reported a significantly lower percentage of daily smokers than those who have not attended graduate school. Figure 2.9 presents the percent of persons who reported daily smoking over the past 30 days by highest level of education attained. For this report, highest level of education attained includes persons who attended but did not complete that level of education. For example, persons who dropped out of high school are included with persons who graduated high school but never attended college. Figure 2.9: Percent of adults who smoked cigarettes daily over the past 30 days by highest level of education attained (question B5)
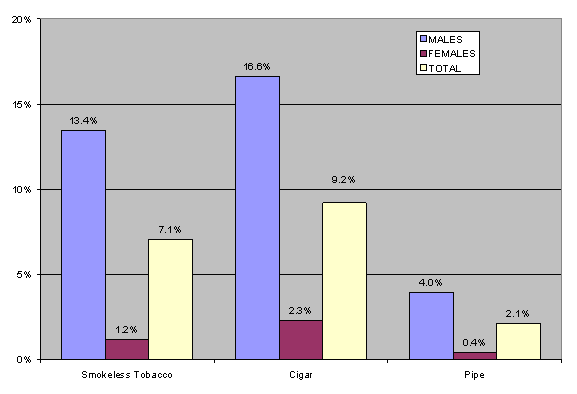
Other Tobacco Adult males used other forms of tobacco significantly more than adult females. Figure 2.10 presents the percent of adults in Kentucky who used other forms of tobacco in the past year. Table 2.5 presents the estimated number of adult Kentuckians who used other forms of tobacco in the past year. Figure 2.10: Percent of adults who used other forms of tobacco within the past 12 months (question B6)
Table 2.5: Estimated number of adult Kentuckians who used other forms of tobacco within the past 12 months (question B6)
|

2004 Report Section Quick Links
Executive Summary * Purpose, Objectives, & Methods * Demographics * Nicotine * Alcohol * Marijuana
Other Drugs * DSM-IV-TR Criteria * Treatment Utilization * Physical & Mental Health * Treatment Need
1999 Report Comparison * Regional Comparison * Jefferson & Fayette Counties * Concluding Remarks