 |
||
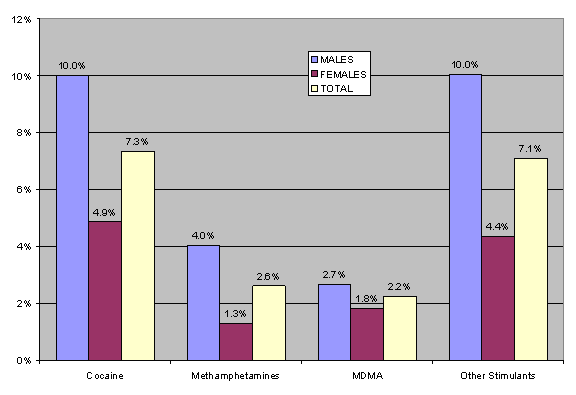
Other DrugsPart A: StimulantsEver Used Stimulants - Stimulants include Cocaine, Methamphetamines, MDMA, and Other Stimulants. MDMA or ecstasy represents a group of methamphetamines which includes methylene-dioxymethamphetamine (MDMA), methylene-dioxyethyl-amphetamine (MDEA), methylene-dioxyamphetamine (MDA), and dimethoxy-bromo-amphetamine (DOB). These drugs produce subjective effects that resemble a combination of amphetamine and hallucinogens and can be considered in their own class of drugs. For purposes of this report, MDMA and all sub-types are being placed in the stimulant category. Adult males were more likely to have ever used cocaine, methamphetamines, and other stimulants than adult females. Figure 5.1 presents the percent of adults who reported ever using stimulants. Table 5.1 presents the estimated number of adult Kentuckians who ever used stimulants. Figure 5.1: Percent of adults who ever used stimulants (question D1)
Table 5.1: Estimated number of adult Kentuckians who ever used stimulants (question D1)
Use within the past year Of those who reported ever using cocaine, females were more likely to have used cocaine in the past year than males. Males who reported ever using MDMA or other stimulants were more likely to have used these substances in the past year than females. Overall, between 10% and 14% of persons who ever used stimulants also used them within the past year. Table 5.2 presents, of those who reported ever using stimulants, the percent of persons who used that stimulant in the past year. Table 5.3 presents the estimated number of adult Kentuckians who used stimulants within the past year. Table 5.2: Percent of persons who used stimulants in the past year (of those who have used that stimulant) (question D3)
Table 5.3: Estimated number of adult Kentuckians who used stimulants within the past year (question D3)
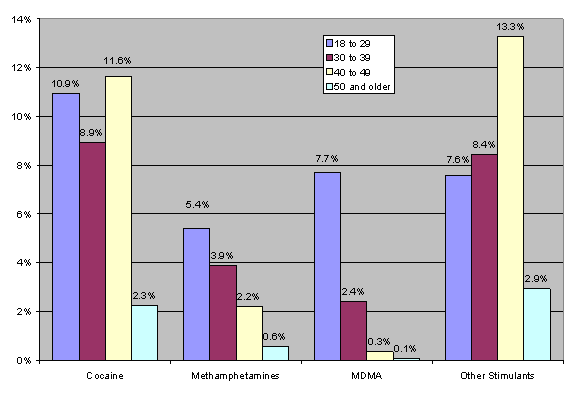
Stimulant Use by Age Group Persons 50 years of age and older were significantly less likely to have used cocaine, methamphetamines, and other stimulants than all other age groups. No other age differences were noted other than 18-29 year olds were more likely to have ever used MDMA than older age groups. Figure 5.2 presents the percent of adult persons who ever used stimulants by age group. Figure 5.2: Percent of adults who ever used stimulants by age group (question D1)
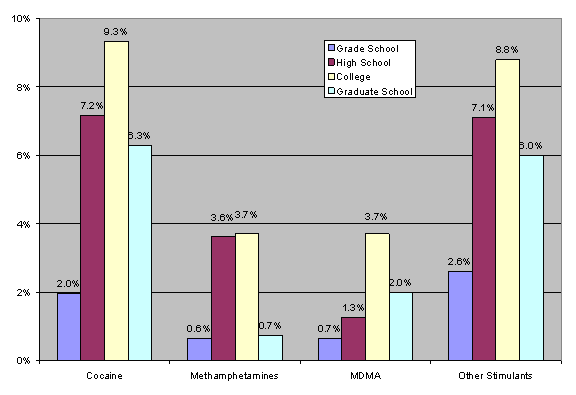
Stimulant Use by Education There was a trend for persons with more education to have been more likely to have ever used stimulants. This trend was reversed for persons who attended graduate school. Persons who attended graduate school tended to be less likely to have ever used stimulants than persons whose highest level of education attained was college. Figure 5.3 presents the percent of persons who ever used stimulants compared to the highest level of education attained. Figure 5.3: Percent of adults who ever used stimulants by highest education attained (question D1)
Ever Thought Stimulant Use a Problem Males were more likely to consider stimulant use a problem than females. This may be partially due to a higher number of males reporting stimulant use than females. Table 5.4 presents the estimated number of adult Kentuckians who ever considered stimulant use to be a problem. For persons who ever used a particular stimulant, a higher percentage of males considered methamphetamines, MDMA, and other stimulants to be a problem than females. Females who ever used cocaine were slightly more likely to have considered cocaine a problem than males. Table 5.5 presents the percent of persons who ever used stimulants and considered that stimulant to have ever been a problem. Table 5.4: Estimated number of adult Kentuckians who considered stimulants to have ever been a problem in their life (question D6)
e estimate too small to calculate accurately Table 5.5: Percent of persons who ever used stimulants and considered that stimulant to ever be a problem in their life (question D6)
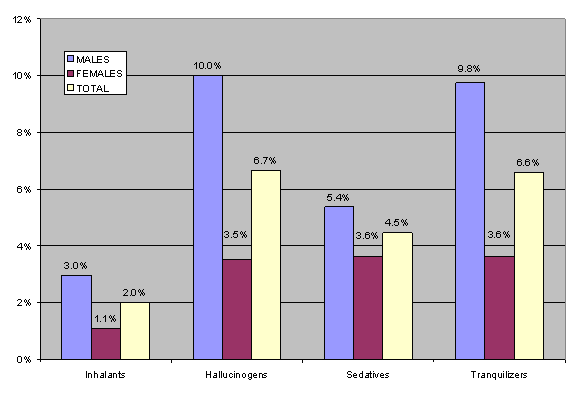
e estimate too small to calculate accurately Part B: Inhalants, Hallucinogens, Sedatives, & TranquilizersEver Used Inhalants/Hallucinogens/Sedatives/Tranquilizers - Inhalants include any volatile substance that is ingested through fumes to achieve intoxication. Hallucinogens include LSD, Peyote, and Psilocybin. Sedatives and Tranquilizers include prescription non-opiates taken beyond the prescribed amount or for the express purpose of achieving intoxication. Adult males were significantly more likely to ever use inhalants, hallucinogens, and tranquilizers than adult females. Figure 5.4 presents the percent of adults who reported ever using inhalants/hallucinogens/sedatives/tranquilizers. Table 5.6 presents the estimated number of adult Kentuckians who ever used inhalants/hallucinogens/sedatives/tranquilizers. Figure 5.4: Percent of adults who ever used inhalants/hallucinogens/sedatives/tranquilizers (question D1)
Table 5.6: Estimated number of adult Kentuckians who ever used inhalants/hallucinogens/sedatives/tranquilizers (question D1)
Use within the past year Of those who reported ever using, females were more likely to use inhalants in the past year than males. Table 5.7 presents the estimated number of adult Kentuckians who used inhalants/hallucinogens/sedatives/tranquilizers within the past year. Table 5.7: Estimated number of adult Kentuckians who used inhalants/hallucinogens/sedatives/tranquilizers within the past year (question D3)
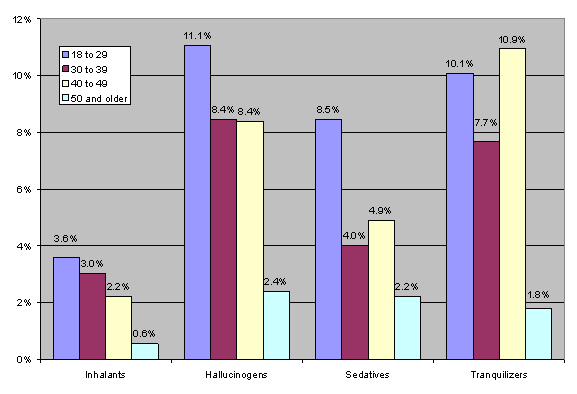
e - estimate too small to calculate accurately Inhalants/Hallucinogens/Sedatives/Tranquilizers Use by Age Group Persons aged 50 and older were less likely to have ever used inhalants, hallucinogens, and tranquilizers than younger age groups. No other differences were noted between any age groups. Figure 5.5 presents the percent of adult persons who ever used inhalants, hallucinogens, sedatives, and tranquilizers by age group. Figure 5.5: Percent of adults who ever used inhalants/hallucinogens/sedatives/tranquilizers by age group (question D1)
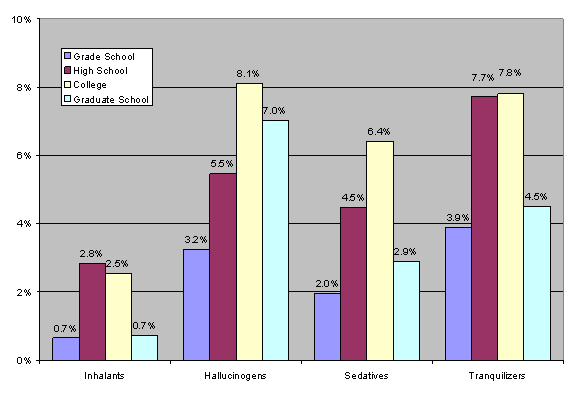
Inhalants/Hallucinogens/Sedatives/Tranquilizers Use by Education There was a trend for persons with more education to be more likely to use inhalants/hallucinogens/sedatives/tranquilizers. This trend was reversed for persons who attended graduate school. Persons who attended graduate school tended to be less likely to use inhalants/hallucinogens/sedatives/tranquilizers than persons who attended and/or completed an undergraduate degree. Figure 5.6 presents the percent of persons who ever used inhalants/hallucinogens/sedatives/tranquilizers compared to the highest level of education attained. Figure 5.6: Percent of adults who ever used inhalants/hallucinogens/sedatives/tranquilizers by highest level of education attained (question D1)
Ever Thought Inhalants/Hallucinogens/Sedatives/Tranquilizers Were a Problem More males considered inhalants and hallucinogens a problem than females. Table 5.8 presents the estimated number of adult Kentuckians who ever considered inhalants/hallucinogens/sedatives/tranquilizers to be a problem. When looking at persons who ever used inhalants/hallucinogens/sedatives/tranquilizers a higher percentage of males considered inhalants to be a problem than females. Females who ever used sedatives were slightly more likely to consider sedatives a problem than males. Table 5.9 presents the percent of persons who ever used inhalants/hallucinogens/sedatives/tranquilizers and considered that drug to be a problem. Table 5.8: Estimated number of adult Kentuckians who considered inhalants/hallucinogens/sedatives/tranquilizers to have ever been a problem (question D6)
Table 5.9: Percent of persons who ever used inhalants/hallucinogens/sedatives/tranquilizers and considered that drug to have ever been a problem (question D6)
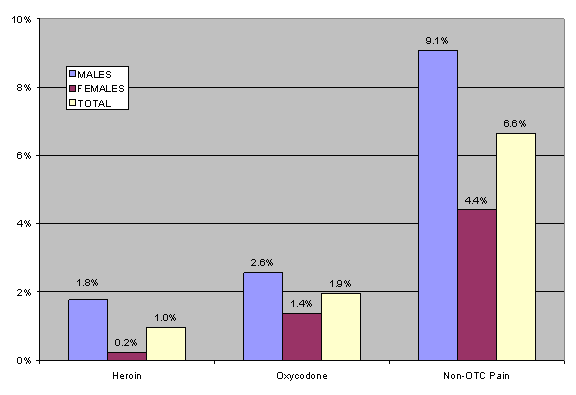
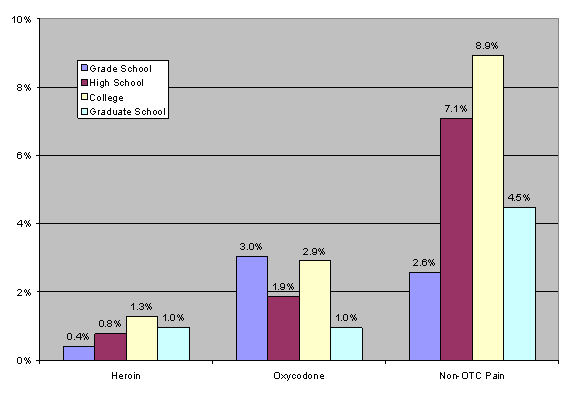
Part C: OpiatesEver Used Opiates - Opiates include heroin, oxycodone, and other non over-the-counter (OTC) pain medications. For prescription opiates, use beyond the prescribed amount or use for the purpose of intoxication is included in this section. Non-OTC pain medication may include some non-opiates. Adult males were significantly more likely to ever use heroin and non-OTC pain medications than adult females. Figure 5.7 presents the percent of adults who reported ever using opiates. Table 5.10 presents the estimated number of adult Kentuckians who used opiates. Figure 5.7: Percent of adults who ever used opiates (question D1)
Table 5.10: Estimated number of adult Kentuckians who ever used opiates (question D1)
Use within the past year Table 5.11 presents the estimated number of adult Kentuckians who used opiates within the past year. Males were slightly more likely to use Oxycodone or Non-OTC pain medications that females. Of the males who participated in this survey none reported using heroin within the past year. Table 5.11: Estimated number of adult Kentuckians who reported using opiates within the past year (question D3)
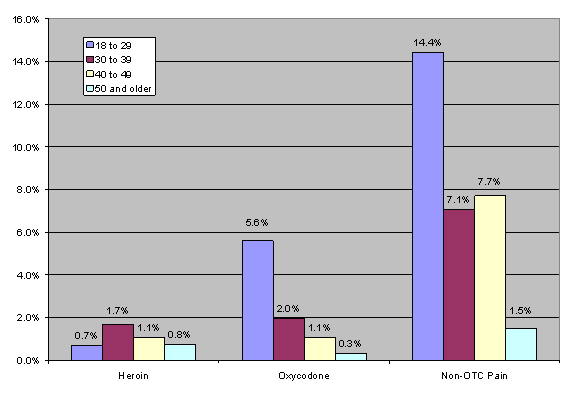
e estimate too small to calculate accurately Opiate Use by Age Group No age differences were noted for heroin. 18-29 year olds were more likely to have ever illicitly used Oxycodone and non-OTC pain medications than older age groups. Persons 50 or more years old were less likely to illicitly use non-OTC pain medications than younger persons. Figure 5.8 presents the percent of adult persons who used opiates by age group. Figure 5.8: Percent of adults who ever used opiates by age group (question D1)
Opiate Use by Education There was a trend for persons with more education to use heroin and Non-OTC pain medications. However, there were no significant differences between any of the education levels. Figure 5.9 presents the percent of persons ever used opiates compared to the highest level of education attained. Figure 5.9: Percent of adults who ever used opiates by highest education attained (question D1)
Ever Thought Opiates a Problem More males were likely to consider opiates a problem than females. Table 5.12 presents the estimated number of adult Kentuckians who considered opiates to be a problem. When only persons who ever used opiates are examined, a higher percentage of females considered heroin and Non-OTC pain medications to be a problem than males. Males who used Oxycodone were slightly more likely to consider opiates a problem than females. Table 5.13 presents the percent of persons who ever used opiates and considered that opiate use to be a problem. Table 5.12: Estimated number of adult Kentuckians who consider opiates to be a problem in their lifetime (question D6)
Table 5.13: Percent of adults who ever used opiates and considered that opiate to ever be a problem in their life (question D6)
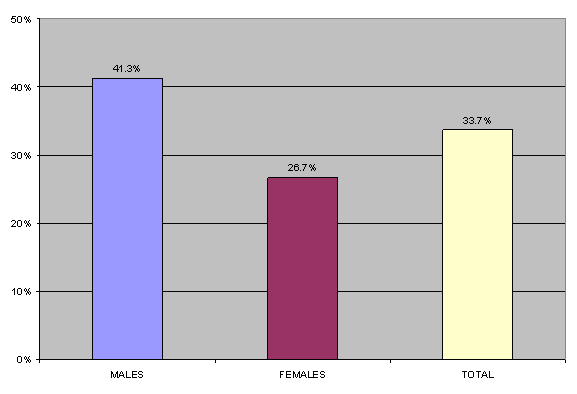
Part D: All Illicit DrugsEver Used Any Illicit Drug Any Illicit Drug includes marijuana and the substances listed in parts A through C. Illicit drugs also includes legal drugs used outside the prescribed amount or for the express purpose of achieving intoxication. Adult males were more likely to have ever used illicit drugs than adult females. Figure 5.10 presents the percent of adults who reported ever using illicit drugs. Table 5.14 presents the estimated number of adult Kentuckians who ever used illicit drugs and Table 5.15 presents the estimated number of adult Kentuckians who used illicit drugs within the past year. Figure 5.10: Percent of adults who ever used an illicit drug (question D1)
Table 5.14: Estimated number of adult Kentuckians who ever used an illicit drug (question D1)
Table 5.15: Estimated number of adult Kentuckians who used an illicit drug within the past year (question D1)
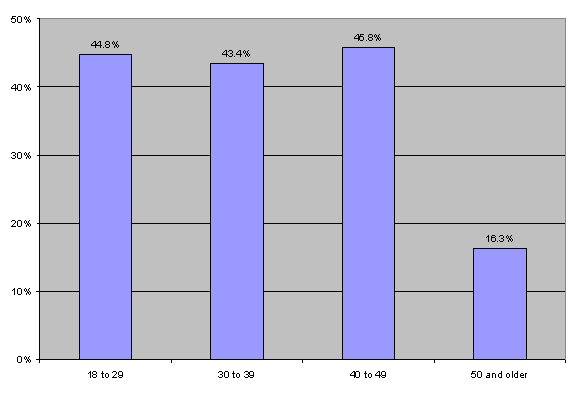
Illicit Drug Use by Age Persons 50 years of age and older were less likely to use an illicit drug than younger persons. No age differences were noted between the other age groups. Figure 5.11 presents the percent of adult persons who used illicit drugs by age group. Figure 5.11: Percent of adults who ever used an illicit drug by age group (question D1)
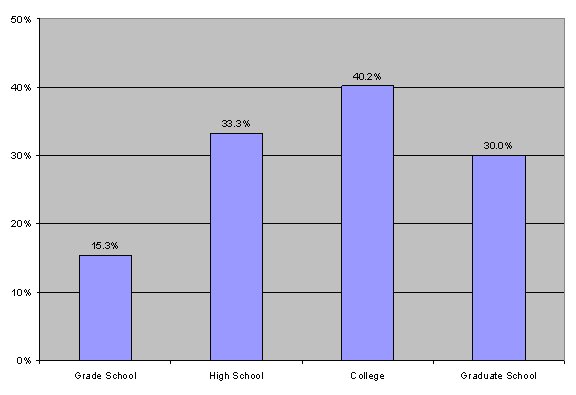
Drug Use by Education Persons whose highest level of education attained was grade school were significantly less likely to ever used illicit drugs. However, there were no other differences between any of the education groups. Figure 5.12 presents the percent of persons who used drugs compared to the highest level of education attained. Figure 5.12: Percent of adults who ever used an illicit drug by highest education attained (question D1)
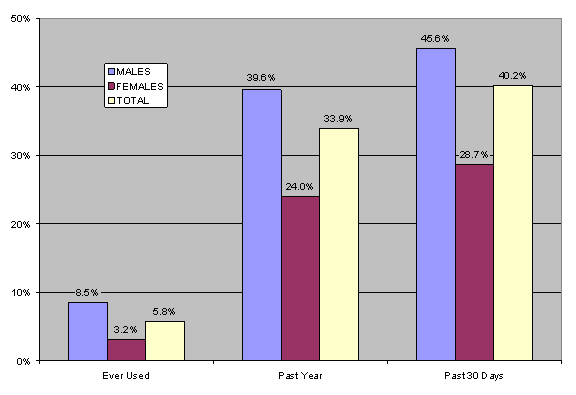
Ever Thought Illicit Drugs a Problem Males were more likely to consider illicit drugs a problem than females. Figure 5.13 presents the percent of adults who considered drugs to ever be a problem in their life based on last use of an illicit substance. Persons who used illicit drugs more recently are more likely to have ever considered their drug use to be problematic. Table 5.16 presents the estimated number of adult Kentuckians who consider their illicit drug use to be a problem. Figure 5.13: Percent of adults who considered their illicit drug to ever be a problem by recency of use (question D6)
Table 5.16: Estimated number of adult Kentuckians who consider their illicit drug use to ever be a problem in their life (question D6)
|
2004 Report Section Quick Links
Executive Summary * Purpose, Objectives, & Methods * Demographics * Nicotine * Alcohol * Marijuana
Other Drugs * DSM-IV-TR Criteria * Treatment Utilization * Physical & Mental Health * Treatment Need
1999 Report Comparison * Regional Comparison * Jefferson & Fayette Counties * Concluding Remarks