 |
||
Section 2. Demographics Adolescents ages 12 to 17 comprise 8.2% of Kentucky 's population. Table 2.1 presents the 2005 United States Census based population distribution of adolescent Kentuckians 18 by age and gender. Males represent 51.4% of Kentucky adolescents compared to 48.6% females. The weighted survey ratios are very similar to the population ratios for gender and age. (For more on weighting, please refer to the Methods section.) Table 2.1: 2005 United States Census Kentucky adolescent population estimates by age and gender
The survey ratios for race/ethnicity were slightly under-representative for Hispanics and African-Americans but very close to Asian/Pacific Islander and Native American estimates. It should be noted that race/ethnicity estimates are based on the entire population rather than adolescents only. Table 2.2 presents the comparison of race and ethnicity between State population estimates and the adolescent survey participants. Table 2.2: Kentucky adolescent race and ethnicity estimates (Survey questions q16, q19)
The majority of survey participants (77.8%) were either the only person under 18 living in the household or one of two persons under 18 living in the household. Over two-thirds (69.4%) of adolescents live in a household with two adults. Table 2.3 presents the distribution of households by the number of adults or children (all persons under 18 years old) living in the house. Table 2.3: Kentucky household distribution by the number of adults and children living in the home (Survey questions q9, q10)
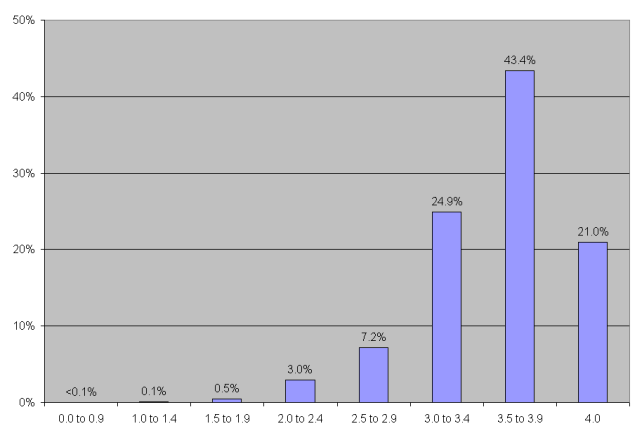
Almost all survey participants were enrolled in school (98.3%). There were no significant age or gender differences between adolescents enrolled and not enrolled in school. An estimated 5,794 adolescent Kentuckians were not enrolled in school last year. Just over 80% of adolescents not enrolled in school reported they were home schooled and 11.1% reported they dropped out of school. Figure 2.1 presents the distribution of grade point average for survey respondents. Note: About half of respondents provided their GPA and only GPA's using a 4.0 scale were included in Figure 2.1. Figure 2.1: Distribution of grade point averages (Survey question q14)
Of the 16 and 17 year old adolescents, 53.4% reported having a driver's license. There was a higher percent of 16 and 17 year olds having a cell phone for personal use (73.4%) than having their driver's license (53.5%). Older adolescents were more likely to have a cell phone than younger adolescents. Table 2.4 presents the percent of adolescents who have a cell phone for personal use by age group. Table 2.4: Percent of adolescent Kentuckians with a cell phone for personal use by age group (Survey question q23)
|
2005 Report Section Quick Links
Executive Summary * Purpose, Objectives, & Methods * Demographics * Nicotine * Alcohol
Drugs * DSM-IV-TR Criteria * Treatment Utilization and Treatment Need *Attitudes & Beliefs
1998 Report Comparison * Regional Comparison * Concluding Remarks