 |
||
DemographicsWeighting Variables - The following three tables describe the demographic characteristics of the survey participants. The weighted* distribution of survey participants mirrors 2003 Kentucky populations estimates for Gender, Age, and MHMR regions. For example, the estimated percent of adult males in Kentucky is 48.3%. The percent of males in the weighted sample is also 48.3%. Tables 1.1 through 1.3 present these data. The estimated number of adult Kentuckians (18 and older) for 2003 is 3,122,455. Table 1.1: Gender (question A2)
Table 1.2: Age (question A1)
Table 1.3: Mental Health/Mental Retardation Regions (question H10)
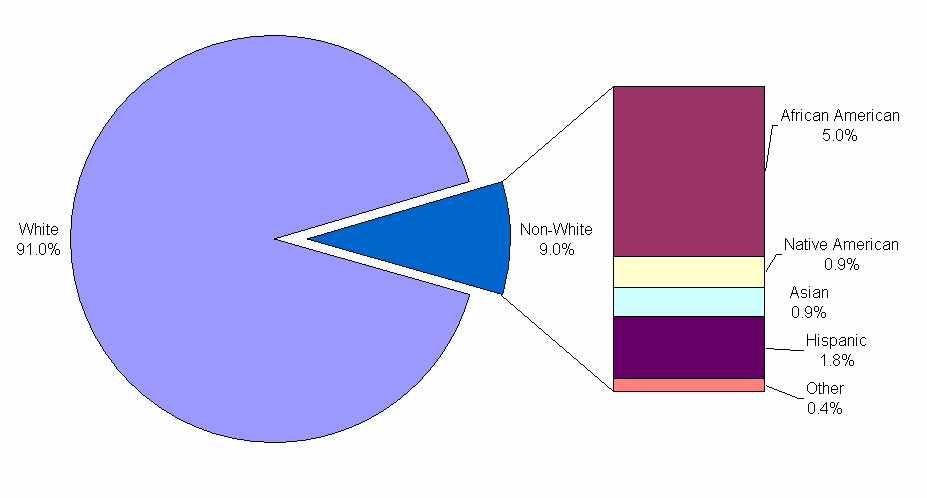
* An explanation of weighting can be found in the Purpose, Objectives, & Methods section Race The race distribution in the sample is very similar to the 2003 population estimates. Figure 1.1 presents the distribution of the survey sample by race. This figure includes Hispanic as a race rather than origin in order to better compare to the 1999 Adult Household Survey. Data is based on self-report to the question Which group best describes you? Figure 1.1 Race (questions A4, A5)
Marital Status The survey is representative of the 2000 US Census estimates for marital status for Kentucky residents. Table 1.4 presents the distribution of persons by marital status for the survey participants and the 2000 estimate. Table 1.4: Marital Status (question H3)
* Census estimate is based on Kentucky residents 15 years of age and older. Employment Status The employment rate is very similar to the 2000 US Census estimate for Kentucky . Table 1.5 presents the distribution of reported employment for the Adult Household Survey. The percentage of employed versus unemployed persons from the 2000 Census was 60.9% employed and 39.1% unemployed for persons aged 16 years and older. The Census did not distinguish between full-time and part-time employment. Persons who were not employed at the time of survey were asked for the primary reason for not working (see Table 1.6). Table 1.5: Employment Rates (question H5)
Table 1.6: Reason for not working (question H5a)
Household Income The distribution of household income reported on the KNAP household survey is similar to the 2000 US Census report of income received in 1999 for Kentucky households. Table 1.7 presents the distribution of reported income levels. With different scales, a direct comparison to the Census data is not possible. However, Table 1.8 presents the Census distribution for comparison purposes. Table 1.7: KNAP Household (question H12)
Table 1.8: 2000 US Census KY
Health Insurance Coverage The majority of survey respondents (85.5%) report having current health insurance coverage. (question G18) Education 12.2% of persons surveyed report they are currently enrolled in school. Table 1.9 presents the highest level of school completed. There were differences between the survey results and the 2000 US Census. The Adult Household Survey showed a higher percentage of persons with some college or college degrees. Table 1.9: Highest Level of School Completed (question H2)
* Census data is based on persons aged 25 years and older Country of Birth 96.5% of respondents report they were born in the United States . Of those persons born outside of the United States , 16.6% were from Great Britain , 16.4% from Germany , and 16.3% from Italy . Of those persons in the survey born in other countries the average length of time living in the United States is 21.1 years. However, one-third (34.6%) of those born abroad had been living in the U.S. for five or fewer years. (question H4) |
2004 Report Section Quick Links
Executive Summary * Purpose, Objectives, & Methods * Demographics * Nicotine * Alcohol * Marijuana
Other Drugs * DSM-IV-TR Criteria * Treatment Utilization * Physical & Mental Health * Treatment Need
1999 Report Comparison * Regional Comparison * Jefferson & Fayette Counties * Concluding Remarks