Kentucky Needs Assessment Project Brief Report
Self-Rated Physical Health among Kentucky Adults
In Brief
• Among adult Kentuckians, poorer physical health ratings were associated with: female gender, minority status, unemployment, lower income, older age, and less education.
• Poorer physical health ratings were also associated with lack of health insurance, more past-year physical health care visits, ratings of poorer emotional health, more days in the past year with emotional problems, and more past-year health care visits for psychological issues.
• Poorer physical health was reported by those who met DSM-IV-TR lifetime criteria for drug abuse or dependence, but alcohol abuse or dependence were not associated with poorer health. The same difference was found between past year drug and alcohol use in relation to self-rated physical health.
INTRODUCTION
An estimated 19.1% of Kentucky adults reported “poor” or “fair” physical health over the past 12 months; 26.1% rated their health as “good,” 29.4% rated it as “very good,” and 25.4% described their physical health as “excellent.” The Kentucky Needs Assessment Project (KNAP) 2004 Adult Household Survey asked adults aged 18 and older about their health, alcohol use, and illicit drug use over their lifetime, past 12 months, and/or past 30 days, as well as other information about substance abuse and dependence. Physical health was self-rated on a five-point scale from excellent to poor for the past year. Self-ratings of health have been consistently found to be useful and accurate correlates of physician-rated health and medical services use. Illicit drug was defined as the unprescribed use of marijuana, cocaine, other stimulants, oxycodone or Oxycontin, other opiates, sedatives, hallucinogens, club drugs, inhalants, or any other substances used for their psychotropic effects, excluding alcohol and tobacco. Substance abuse and dependence were defined using Diagnostic and Statistical Manual of Mental Disorders Fourth Edition, Text Revised (DSM-IV-TR) criteria. Abuse and dependence should not be interpreted as clinical diagnoses. This report focuses on self-reported physical health by Kentucky adults aged 18 and over.
STUDY OVERVIEW
The Kentucky Needs Assessment Project (KNAP) is a series of studies designed to estimate substance use levels and substance abuse treatment need of Kentuckians. Data for this report were taken from the 2004 Adult Household Survey, a telephone survey of 4,210 Kentucky households using random digit dialing. Only respondents in residential households were sampled and included. The findings from this study can only be generalized to adults residing in Kentucky households, and not to those in institutional, dormitory or group home settings. Another potential source of bias is the understatement or overstatement of actual behaviors. The validity of self-report data depends on the honesty, memory, and understanding of the respondents. The detailed methodology of this study is described in the full report which can be viewed at https://cdar.uky.edu.
DEMOGRAPHIC CHARACTERISTICS AND SELF-RATED PHYSICAL HEALTH
The percentage of Kentucky adults 18 years of age and older who reported fair or poor physical health in the past year is an estimated 19.1%.
Gender – An estimated 21% of adult Kentuckian females reported their physical health as fair or poor, compared to 17.2% of males.
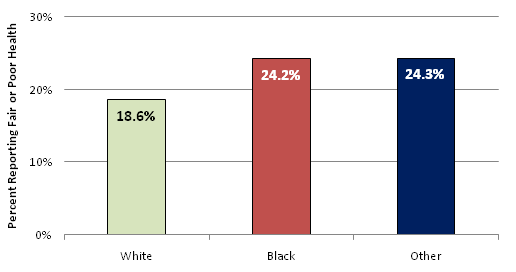
Race – An estimated 18.6% of white adult Kentuckians reported fair or poor physical health in the past year, and an estimated 24.2% of black adult Kentuckians reported fair or poor health in that same time period. An estimated 24.3% of adult, non-black minority Kentuckians reported fair or poor health (figure 1).
Figure 1: Percent of Adult Kentuckians Reporting Fair or Poor Physical Health by Race
Education – Adult Kentuckians with less formal education reported poorer physical health during the past year. An estimated 40.3% of those with less than a high school diploma or GED reported fair or poor health, whereas only 9.9% of those with bachelor’s degrees reported fair or poor physical health. Additionally, 20.3% of Kentuckians with high school diplomas but less that a college degree reported fair or poor health.
Current Employment – An estimated 32.2% of unemployed adult Kentuckians reported having fair or poor physical health over the past year. The percentage fell for those who were employed part time (16.3% with fair or poor health), and for those with full time employment (9.6% with fair or poor health).
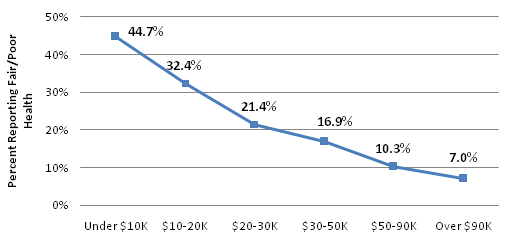
Income – Adult Kentuckians with the lowest household incomes reported higher percentages of fair or poor physical health. Specifically, 44.7% of respondents with annual household incomes of less than $10,000 reported physical health in the previous year as fair or poor. In contrast, only 7.0% of respondents with annual household incomes of more than $90,000 reported fair or poor physical health status (figure 2).
Figure 2: Percent of Adult Kentuckians Reporting Fair or Poor Physical Health by Household Income
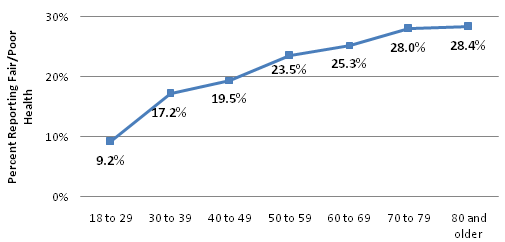
Age – An estimated 25.4% of Kentuckians age 50 or older reported fair or poor physical health, whereas only 15.1% of those younger than 50 reported the same (figure 3).
Figure 3: Percent of Adult Kentuckians Reporting Fair or Poor Physical Health by Age
HEALTH CARE UTILIZATION AND SELF-RATED PHYSICAL HEALTH
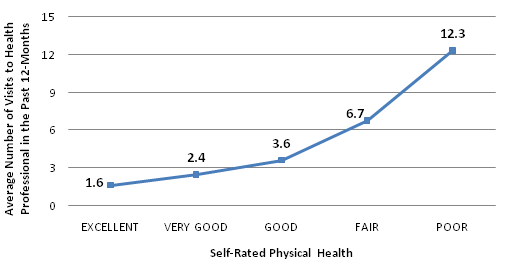
Health Care Visits – Adult Kentuckians who rated their physical health as fair or poor reported an estimated 8.6 appointments with health care professionals in the previous year. Those rating their physical health as good, very good, or excellent had an estimated 2.6 health care visits in the past year (figure 4).
Figure 4: Average Number of Visits to Health Professional in Past Year by Self-Rated Physical Health
Health Insurance Coverage – Adult Kentuckians without health insurance coverage were more likely to report having fair or poor physical health in the past year compared to adult Kentuckians with health insurance coverage, 26.1% vs. 18.0% respectively.
PSYCHOLOGICAL STATUS AND SELF-RATED PHYSICAL HEALTH
Visits to Mental Health Professional for Psychological Services – Adult Kentuckians who rated their physical health as fair or poor were more likely to visit a mental health professional in the previous year than persons who rated their physical health as good, very good, or excellent, 21.1% versus 8.4%, respectively.
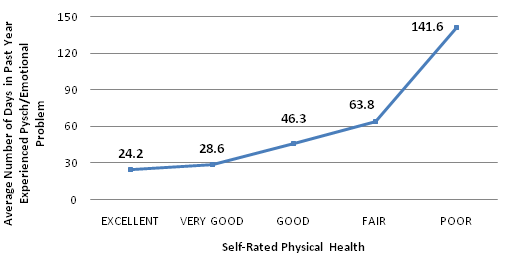
Number of Days with Emotional Problems – Adult Kentuckians who reported their physical health as fair or poor during the past year reported more days with emotional problems during the past year (average 91.6 days) than those reporting good, very good or excellent physical health in the previous year (average 34.2 days; figure 5).
Figure 5: Average Days in Past Year with Psychological Problem by Self-Rated Physical Health
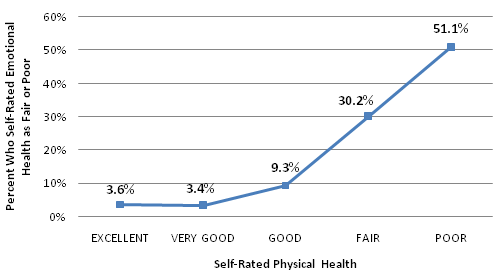
Self-Rated Emotional Health – Self-ratings of physical and emotional health are related. Specifically, among adult Kentuckians, the percentage of those who rated their emotional health as fair or poor was greatest among those who rated their physical health as fair or poor. For example, only 5.4% of those rating their psychological health as fair or poor rated their physical health as excellent, very good, or good; however, 37.2% of those rating their psychological health as fair or poor rated their physical health as fair or poor (figure 6).
Figure 6: Self-Rated Emotional Health by Self-Rated Physical Health in the Past Year
SUBSTANCE ABUSE AND DEPENDENCE, AND SELF-RATED PHYSICAL HEALTH
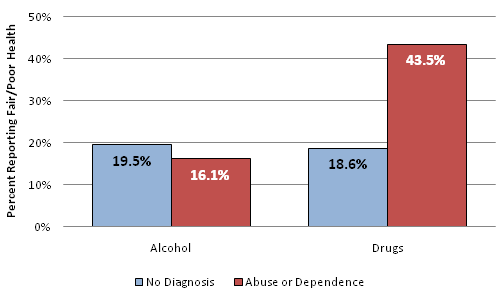
Lifetime Alcohol and Illicit Drug Abuse and Dependence – Among adult Kentuckians who met DSM-IV-TR criteria for drug abuse or dependence during their lifetime, 43.5% reported having fair or poor physical health, whereas only 18.6% of those not meeting these criteria reported fair or poor physical health. The difference between adult Kentuckians meeting and not meeting criteria for alcohol abuse or dependence was not as large. 16.1% of those meeting alcohol abuse or dependence criteria reported having fair or poor health as compared to 19.5% of those not meeting criteria. Note that the associations of these drug and alcohol measures with self-rated physical health were in the opposite direction (figure 7).
Figure 7: DSM-IV-TR Defined Lifetime Alcohol or Drug, Abuse or Dependence by Self-Rated Fair or Poor Physical Health in Past Year
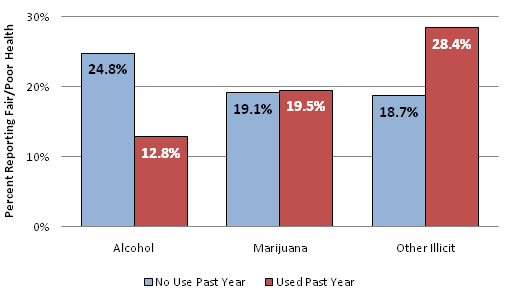
Use of Alcohol, Marijuana, and Illicit Drugs in Past Year – Adult Kentuckians who used alcohol in the past year were only half as likely to report fair or poor health (12.8%) as non-users of alcohol (24.8%) over the same period. Users and non-users of marijuana during the past year reported similar levels of fair/poor physical health, 19.5% versus 19.1%, respectively. 28.4% of users of illicit drugs in the previous year reported fair or poor health, whereas 18.7% of non-users of illicit drugs reported the same level of fair or poor health. Again, note that these associations for alcohol and drug users were in opposite directions (figure 8).
Figure 8: Percent of Adult Kentuckians Reporting Fair or Poor Physical Health by Past Year Alcohol, Marijuana, or Other Illicit Drug Use
SUMMARY
Self-rated physical health status, as measured by the simple five-level scale ranging from excellent to poor, has been repeatedly found to be a useful correlate of physician-rated physical health. This measure of physical health was examined for its relationships with adult Kentuckian demographic characteristics, health service utilization, psychological status, and substance use.
In relation to demographic characteristics, the following were associated with poorer health ratings: female gender, minority race/ethnicity, unemployment, lower household income, less education, and older age. Poorer self-ratings of physical health were also associated with having no health insurance and having made more past-year health care visits. Ratings of poorer physical health were strongly related to self-ratings of poorer psychological health, more past year visits for mental health services, and more days in the past year with psychological problems. Finally, self-ratings of fair or poor physical health were associated with DSM-IV-TR lifetime criteria for drug abuse or dependence. However, lifetime criteria for alcohol abuse or dependence were more likely in those who rated their physical health more positively. The same difference was found in relation to self-rated physical health and use of alcohol and illicit drugs in the past year.
The association of self-rated health and drug abuse/dependence is most likely reciprocal, with each exercising some influence over the other. Treatment of drug abuse may benefit both perceived and actual health status, just as improving health is likely to reduce the stress that stimulates drug use initiation, intensification, and relapse.
Acknowledgements
This report was prepared by the University of Kentucky Center on Drug and Alcohol Research under contract from the Kentucky Cabinet for Health and Family Services, Department of Mental Health and Mental Retardation Services, Division of Mental Health and Substance Abuse. Contributors include Matthew Webster (Principal Investigator), Thomas Garrity (Co-Investigator), David Clark (Study Director), and Carl Leukefeld (Co-Investigator).
Click here for a .pdf version of this report.
Click here to return to the Kentucky Needs Assessment Project home page.