Kentucky Needs Assessment Project Brief Report
Comparison of Attitudes and Beliefs about Substance Use among Kentucky Adults in Metropolitan and Non-Metropolitan Areas
In Brief:
• Adult Kentuckians living in non-metropolitan counties were 36.2% more likely to believe the county they live in has a bigger drug and alcohol problem compared to most other counties in Kentucky
• Adult Kentuckians in non-metropolitan counties were more likely to perceive risk associated with drug and alcohol use compared to adult Kentuckians living in metropolitan counties
• Adults Kentuckians living in metropolitan counties report lower rates of past year use of drugs and alcohol, past year DSM-IV-TR alcohol abuse criteria and current treatment need compared to adults in non-metropolitan counties
INTRODUCTION
Just over half (50.1%) of adult Kentuckians believe that Kentucky has a bigger drug and alcohol problem than most other states. Similarly, 50.9% of adult Kentuckians believe the county they live in has a bigger drug and alcohol problem compared to other counties in Kentucky. This report examines differences in attitudes and beliefs about drug and alcohol problems between adults living in metropolitan and non-metropolitan counties. This report will also explore differences in drug and alcohol prevalence estimates between metropolitan and non-metropolitan counties as defined by the USDA Economic Research Service. The Kentucky Needs Assessment Project (KNAP) 2007 Adult Household Survey asked adults aged 18 and older about their alcohol and illicit drug use over their lifetime, past 12 months, and past 30 days, as well as other information about substance abuse and dependence. Illicit drug use was defined as the unprescribed use of marijuana, cocaine, other stimulants, oxycodone or OxyContin, other opiates, sedatives, hallucinogens, club drugs, inhalants, or any other substances used for their psychotropic effects, excluding alcohol and tobacco. Substance abuse and dependence were defined using Diagnostic and Statistical Manual of Mental Disorders Fourth Edition, Text Revised (DSM-IV-TR) criteria . Abuse and dependence should not be interpreted as clinical diagnoses. Survey participants were also asked their beliefs about the extent of drug and alcohol problems in their area and how much risk is involved in using certain substances. Beliefs about drug and alcohol problems in their area were self-rated on Likert-type scale including strongly disagree, somewhat disagree, neither agree nor disagree, somewhat agree, and strongly agree. Risk of harm was also rated on a Likert-type scale including no risk, slight risk, moderate risk, and great risk.
STUDY OVERVIEW
The Kentucky Needs Assessment Project (KNAP) is a series of studies designed to estimate substance use levels and substance abuse treatment need of Kentuckians. Data for this report were taken from the 2007 Adult Household Survey, a telephone survey of 3,312 Kentucky households using random digit dialing. Only respondents in residential households were sampled and included. The findings from this study can only be generalized to adults residing in Kentucky households, and not to those in institutional, dormitory or group home settings. Another potential source of bias is the understatement or overstatement of actual behaviors. The validity of self-report data depends on the honesty, memory, and understanding of the respondents. The detailed methodology of this study is described in the full report which can be viewed here.
DEMOGRAPHIC CHARACTERISTICS OF PERSONS IN METROPOLITAN AND NON-METROPOLITAN COUNTIES
Metropolitan and Non-Metropolitan Counties – The USDA Economic Research Service has developed a set of Rural-Urban Continuum Codes. Every county in the United States is ranked from 1 to 9 with larger numbers indicating a greater level of rurality. Counties rated from 1 to 3 are defined as metropolitan. In Kentucky 35 of the 120 counties (29.2%) are designated as metropolitan. These 35 counties contain 56.1% of the state’s population.
Age – The average age of adult Kentuckians in metropolitan counties was slightly younger than adult Kentuckians in non-metropolitan counties (45.9 vs. 46.6 years).
Gender – There were no differences in the percent of adult Kentuckians who were male between metropolitan and non-metropolitan counties (48% for both).
Race – Adult Kentuckians in non-metropolitan counties were more likely to be white (95.8%) compared to adult Kentuckians in metropolitan counties (85.3%).
Education – Adult Kentuckians living in metropolitan counties were more likely to have a high school diploma (91.5% vs. 85.2%) or a college degree (39.0% vs. 23.4%) compared to adult Kentuckians living in non-metropolitan counties.
Income – Adult Kentuckians living in metropolitan counties were much more likely to report a household income of at least $50,000 per year (57.2%) compared to adult Kentuckians living in non-metropolitan counties (39.6%).
INDICATORS OF ALCOHOL AND DRUG PROBLEMS
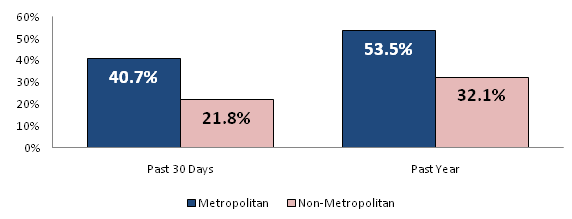
Alcohol Use – Adult Kentuckians living in metropolitan counties were more likely to have drunk alcohol in the past year and past 30 days compared to adult Kentuckians living in non-metropolitan counties (Figure 1). Survey participants were considered as current daily drinkers if they reported drinking at least 25 out of the past 30 days. Adult Kentuckians living in metropolitan counties were more likely to be current daily drinkers compared to adult Kentuckians living in non-metropolitan counties (4.2% and 2.7% respectively).
Figure 1: Percent of adult Kentuckians who drank alcohol in the past 30 days and past year
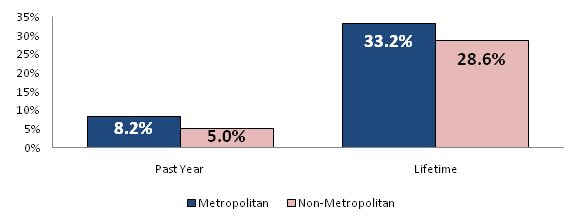
Drug Use – Adult Kentuckians living in metropolitan counties were more likely to have used illicit drugs in the past year and in their lifetime compared to adult Kentuckians living in non-metropolitan counties (Figure 2).
Figure 2: Percent of adult Kentuckians who used illicit drugs in the past year and in their lifetime
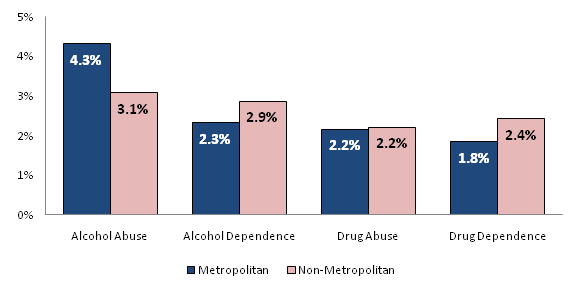
Past Year DSM-IV-TR Criteria and Treatment Need – Adult Kentuckians living in metropolitan counties were more likely to have met past year criteria for alcohol abuse but less likely to have met criteria for past year alcohol dependence and past year drug dependence compared to adult Kentuckians living in non-metropolitan counties (Figure 3).
Figure 3: Percent of adult Kentuckians who met past year DSM-IV-TR criteria for a substance use disorder
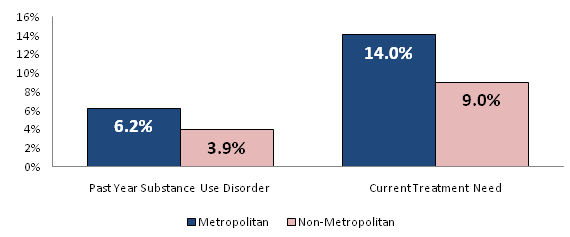
Abuse and dependence criteria are asked independently of each other and some persons may be counted in multiple categories. To clarify, adult Kentuckians meeting any past year substance use disorder (alcohol or drug, abuse or dependence) were combined into a single group. Adult Kentuckians in metropolitan counties were more likely to meet criteria for a past year substance use disorder compared to adult Kentuckians living in non-metropolitan counties.
Current need for drug and alcohol treatment was defined as meeting one or more of the following criteria: past year substance use disorder, self-reported need for treatment, engaging in high risk behaviors due to substance use, or using substances in the past 30 days while currently pregnant. For a more detailed description of treatment need definition please see the KNAP 2007 Adult Household Survey Report . Adult Kentuckians living in metropolitan counties were also more likely to currently need drug and alcohol treatment services compared to adult Kentuckians living in non-metropolitan counties (Figure 4).
Figure 4: Percent of adult Kentuckians who met past year criteria for a DSM-IV-TR substance use disorder and who currently need drug and alcohol treatment
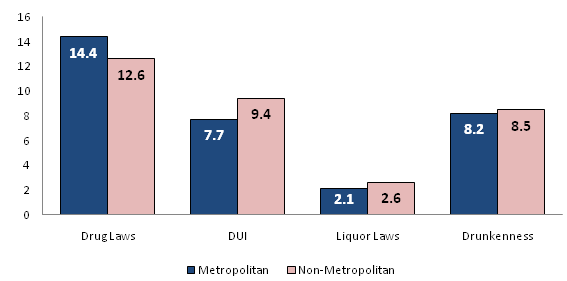
Drug and Alcohol Related Arrests – The Kentucky State Police publishes an annual Crime in Kentucky report which includes county-level arrest data . Categories include drug law arrests, driving under the influence (DUI) arrests, liquor law arrests, and arrests for drunkenness. In 2006, metropolitan counties had a higher per capita arrest rate for drug law arrests than non-metropolitan counties. Conversely, in 2006 non-metropolitan counties had higher per capita arrest rates for DUI, liquor laws, and drunkenness compared to metropolitan counties (Figure 5).
Figure 5: Arrest rates per 1000 residents in 2006
BELIEFS ABOUT DRUG AND ALCOHOL PROBLEM SEVERITY
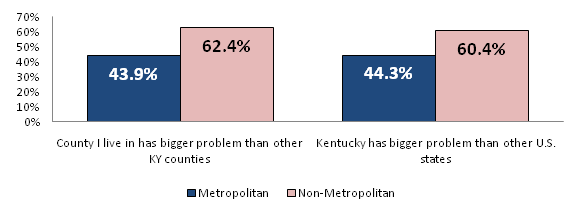
Problem Severity – Survey participants were asked if they thought Kentucky has a bigger drug and alcohol problem than most other states. Participants were also asked if they thought the county they lived in had a bigger drug and alcohol problem than most other counties in Kentucky. Adult Kentuckians living in non-metropolitan counties were more likely to agree with both questions compared to adult Kentuckians living in metropolitan counties (Figure 6).
Figure 6: Percent of adult Kentuckians who believe they live in an area with a bigger drug and alcohol problem than other areas
PERCEPTIONS OF RISK
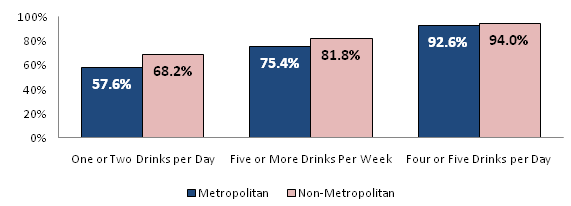
Risk From Alcohol – Survey participants were asked to rate the amount of risk a person puts themselves at by drinking one to two drinks per day, five or more drinks per week, and four or five drinks per day. Adult Kentuckians living in non-metropolitan counties were more likely to consider each level of alcohol use as a moderate or great risk compared to adult Kentuckians living in metropolitan counties (Figure 7).
Figure 7: Percent of adult Kentuckians who consider alcohol use levels as a moderate or great risk
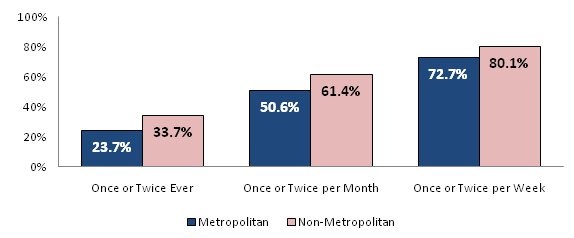
Risk from Marijuana – Survey participants were asked how much risk a person puts themselves in if they smoked marijuana once or twice in their lifetime, once or twice per month, and once or twice per week. Adult Kentuckians living in non-metropolitan counties were more likely to consider marijuana use to be a moderate or great risk compared to adult Kentuckians living in metropolitan counties (Figure 8).
Figure 8: Percent of adult Kentuckians who consider marijuana use levels as a moderate or great risk
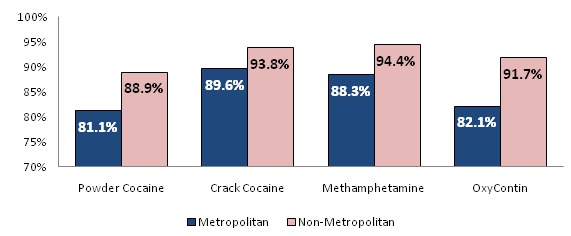
Risk from Other Drugs – Survey participants were asked how much risk a person puts themselves in if they ever used powder cocaine, crack cocaine, methamphetamine, and OxyContin. Adult Kentuckians living in non-metropolitan counties were more likely to consider use of these drugs a moderate or great risk compared to adult Kentuckians living in metropolitan counties (Figure 9).
Figure 9: Percent of adult Kentuckians who consider use of cocaine, methamphetamine, and OxyContin a moderate or great risk
SUMMARY
Adult Kentuckians residing in metropolitan counties were more likely to have used alcohol and illicit drugs in the past year, were more likely to meet criteria for a substance use disorder in the past year, and are more likely to currently need drug or alcohol treatment services compared to adult Kentuckians living in non-metropolitan counties. According to the Kentucky State Police, metropolitan counties had higher arrest rates for drug law violations compared to non-metropolitan counties but lower rates of DUI, liquor law, and drunkenness arrests. It should be noted that the KNAP survey results are based on county of residence while Kentucky State Police data are based on county of arrest. It is possible for a person to live in a non-metropolitan county and be arrested in a metropolitan county or the reverse.
Adult Kentuckians in non-metropolitan counties were more likely to perceive risk associated with drug and alcohol use compared to adult Kentuckians living in metropolitan counties. Additionally, adult Kentuckians living in non-metropolitan counties were 42.1% more likely to believe the county they live in has a bigger drug and alcohol problem compared to most other counties in Kentucky. There are many factors which could impact this perception. Differences in income, education, race, and perception of risk associated with substance use could all affect how different groups perceive their county of residence.
Acknowledgements
This report was prepared by the University of Kentucky Center on Drug and Alcohol Research under contract from the Kentucky Cabinet for Health and Family Services, Department of Mental Health and Mental Retardation Services, Division of Mental Health and Substance Abuse. Contributors include Matthew Webster (Principal Investigator), Thomas Garrity (Co-Investigator), and David Clark (Study Director).
Click here for a .pdf version of this report
Click here to return to the Kentucky Needs Assessment Project home page.