 |
||
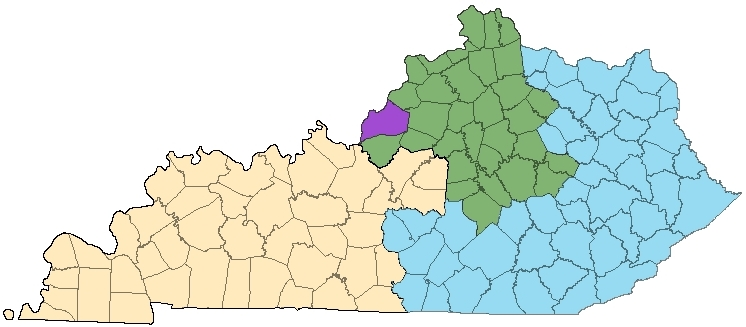
Section 10. Regional ComparisonsKentucky was partitioned into three regions for sampling purposes. Regions were nested in Mental Health/Mental Retardation (MHMR) regions. Additionally Jefferson County was considered a separate and distinct region. Figure 10.1 presents the map of Kentucky by sampling region. Figure 10.1: Sampling regions
West Region MHMR's: Communicare, Four Rivers , Lifeskills, Penny Royal, River Valley Counties: Allen, Ballard, Barren, Breckenridge, Butler, Caldwell, Calloway, Carlisle, Christian, Crittenden, Daviess, Edmonson, Fulton, Graves, Grayson, Hancock, Hardin, Hart, Henderson, Hickman, Hopkins, Larue, Livingston, Logan, Lyon, Marion, Marshall, McCracken, McLean, Meade, Metcalfe, Monroe, Muhlenberg, Nelson, Ohio, Simpson, Todd, Trigg, Union, Warren, Washington, Webster East Region MHMR's: Adanta, Comprehend, Cumberland , Kentucky River, Mountain, Pathways Counties: Adair, Bath, Bell, Boyd, Bracken, Breathitt, Carter, Casey, Clay, Clinton, Cumberland, Elliott, Fleming, Floyd, Green, Greenup, Harlan, Jackson, Johnson, Knott, Knox, Laurel, Lawrence, Lee, Leslie, Letcher, Lewis, Magoffin, Martin, Mason, McCreary, Menifee, Montgomery, Morgan, Owsley, Perry, Pike, Pulaski, Robertson, Rockcastle, Rowan, Russell, Taylor, Wayne, Whitley, Wolfe North-Central Region MHMR's: Bluegrass, Seven Counties (excluding Jefferson Co.), North Key Counties: Anderson , Boone, Bourbon, Boyle, Bullitt, Campbell , Carroll, Clark, Estill, Fayette, Franklin , Gallatin, Garrard, Grant, Harrison, Henry, Jessamine, Kenton, Lincoln , Madison , Mercer, Nicholas, Oldham, Owen, Pendleton, Powell, Scott, Shelby , Spencer, Trimble, Woodford The East and West regions have the highest adolescent lifetime prevalence for smoking cigarettes. Jefferson County and the West region have the highest lifetime prevalence for drinking. Jefferson County has higher lifetime prevalence for all other drugs except hallucinogens and sedatives. Table 10.1 presents the lifetime prevalence rates for cigarettes, alcohol, and other drugs. Table 10.2 presents the estimated number of adolescent Kentuckians who ever used cigarettes, alcohol, and other drugs. Table 10.1: Lifetime cigarette, alcohol, and drug use prevalence rates for adolescent Kentuckians by region
Table 10.2: Estimated number of adolescent Kentuckians who ever used cigarettes, alcohol, and other drugs by region
The West region has the highest prevalence rate of alcohol abuse and alcohol dependence* for adolescent Kentuckians. Jefferson County has the highest prevalence rate of drug abuse and dependence. The West region also has the highest treatment need in the state. Table 10.3 presents the prevalence rates for abuse and dependence and current treatment need. Table 10.4 presents the estimated number of adolescent Kentuckians who meet abuse or dependence criteria in their lifetime or need treatment by region. Table 10.3: Substance abuse and dependence* prevalence and current treatment need for adolescent Kentuckians by region
* The term dependence in this report is not meant to be interpreted as a formal diagnosis. Any person who reported three or more DSM-IV-TR lifetime criteria is included as dependent. |
2005 Report Section Quick Links
Executive Summary * Purpose, Objectives, & Methods * Demographics * Nicotine * Alcohol
Drugs * DSM-IV-TR Criteria * Treatment Utilization and Treatment Need *Attitudes & Beliefs
1998 Report Comparison * Regional Comparison * Concluding Remarks