 |
||
Section 5. DrugsOlder adolescent Kentuckians were more likely to use drugs than younger adolescents for all substances. Adolescent males were more likely to have ever used marijuana, stimulants other than cocaine, oxycodone and other opiates, hallucinogens, club drugs, inhalants, than females. Females were more likely to have ever used sedatives and other drugs than males. Table 5.1 presents lifetime prevalence for drug use by gender. Each drug is discussed in more detail in the following pages. Table 5.1: Lifetime drug use prevalence for adolescent Kentuckians by gender (Survey questions q37-q63)
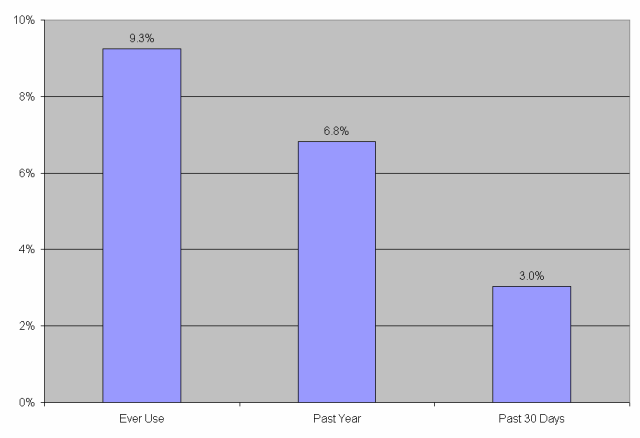
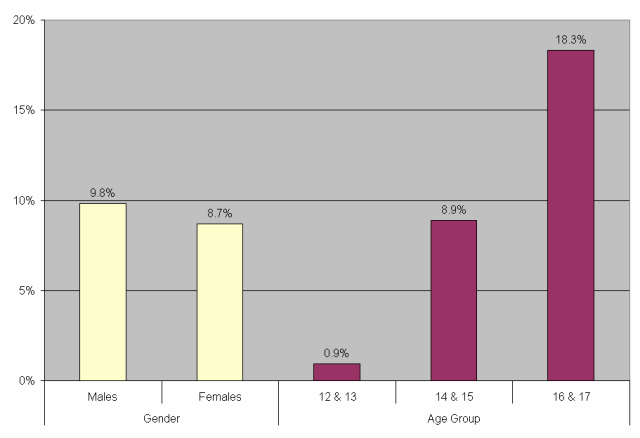
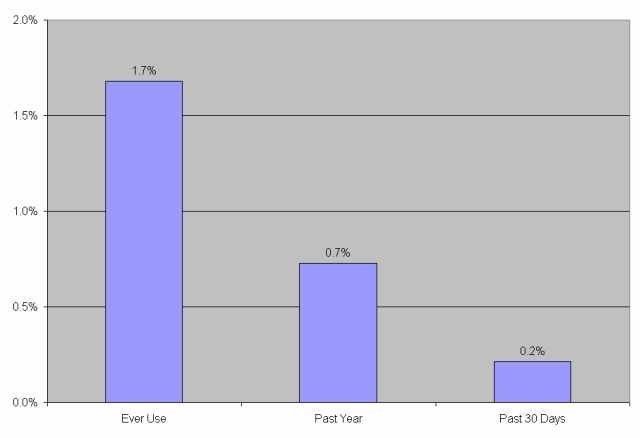
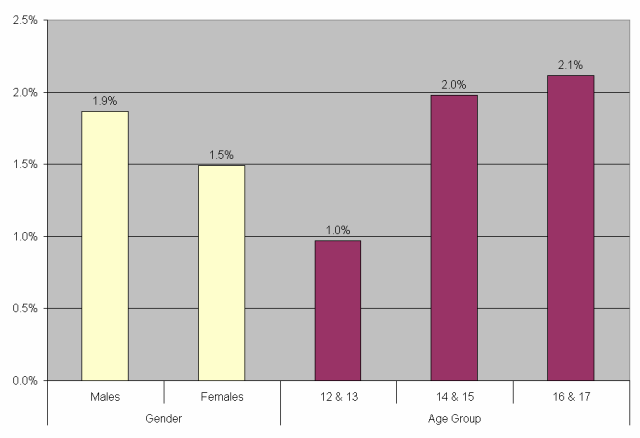
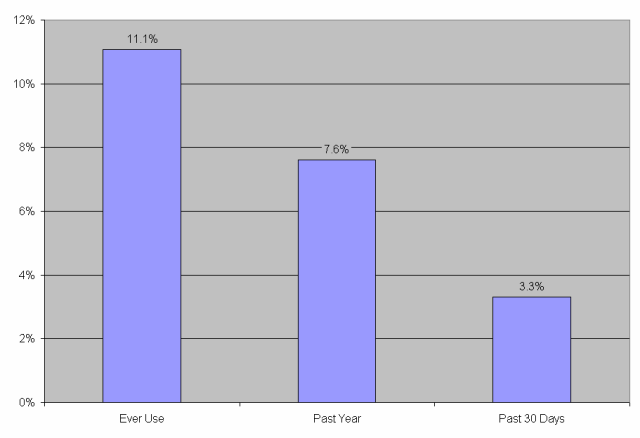
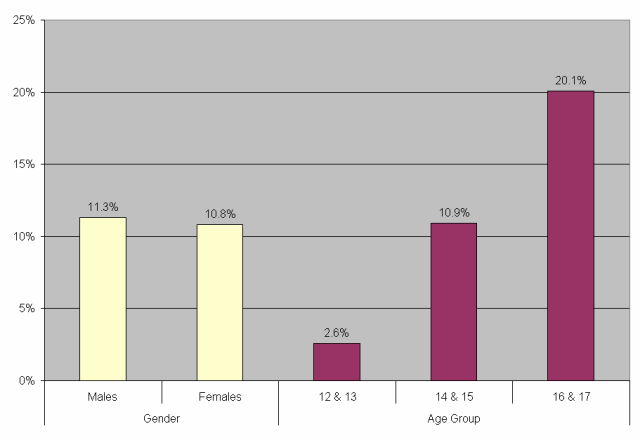
Marijuana Adolescent male Kentuckians are more likely than females to use marijuana. Older adolescent Kentuckians are more likely to use marijuana than younger adolescents. Figure 5.1 presents the lifetime, past year, and past 30 day use rates for marijuana. Figure 5.2 presents the lifetime use rates for marijuana by age and gender. Table 5.2 presents the estimated number of adolescent Kentuckians who use marijuana. Figure 5.1: Lifetime, past year, and past 30 day marijuana use rates for adolescent Kentuckians (Survey question q38) Figure 5.2: Lifetime marijuana use rates for adolescent Kentuckians by age and gender (Survey question q37) Table 5.2: Estimated number of adolescent Kentuckians who ever used marijuana (Survey question q37)
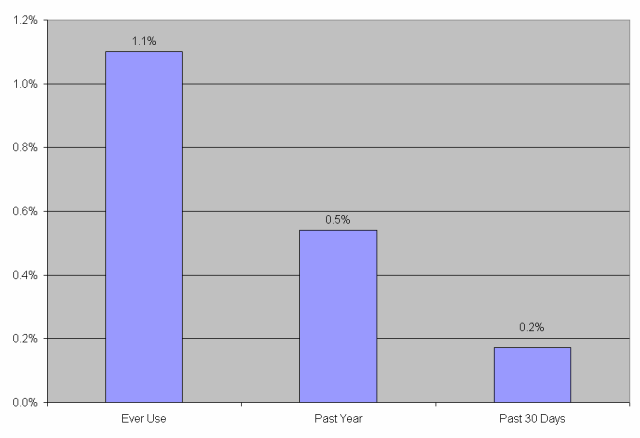
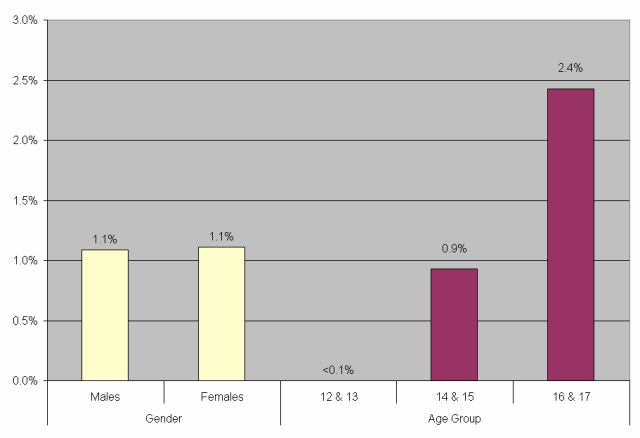
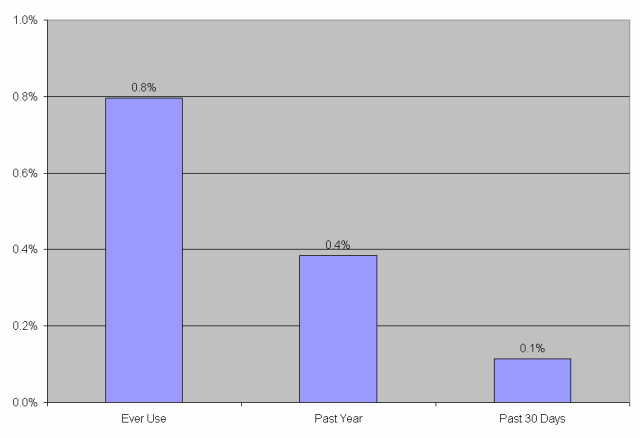
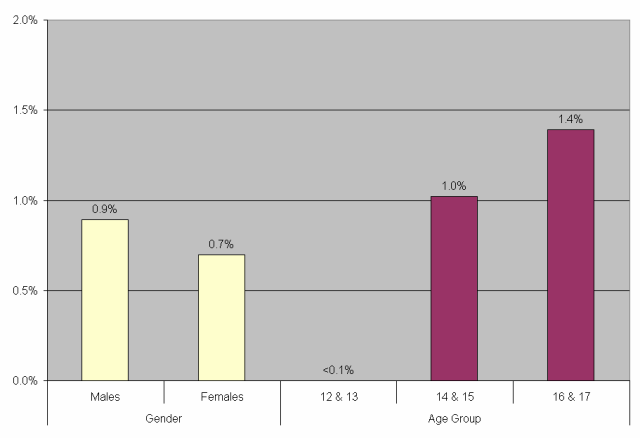
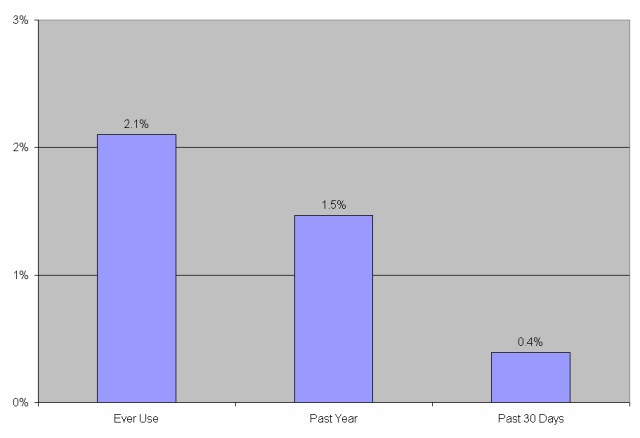
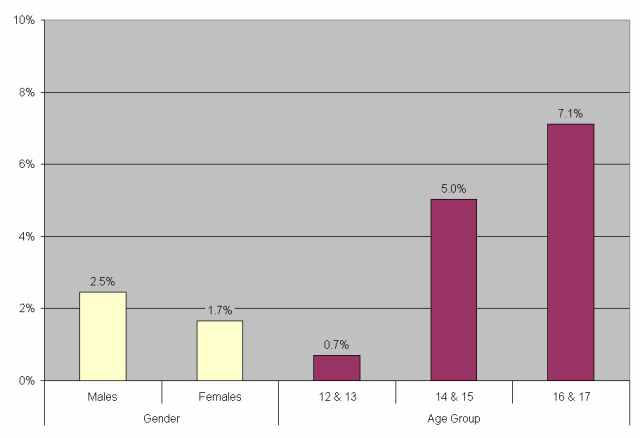
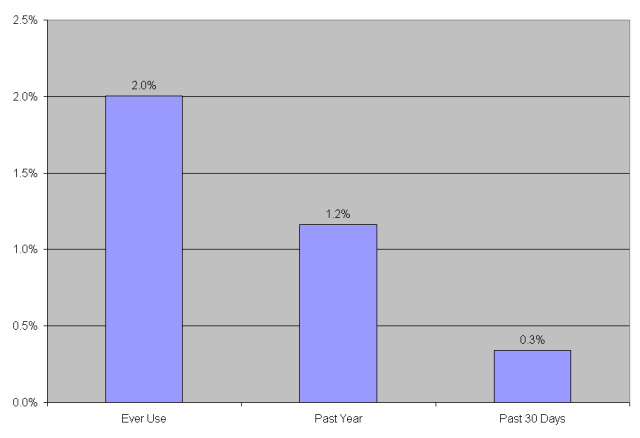
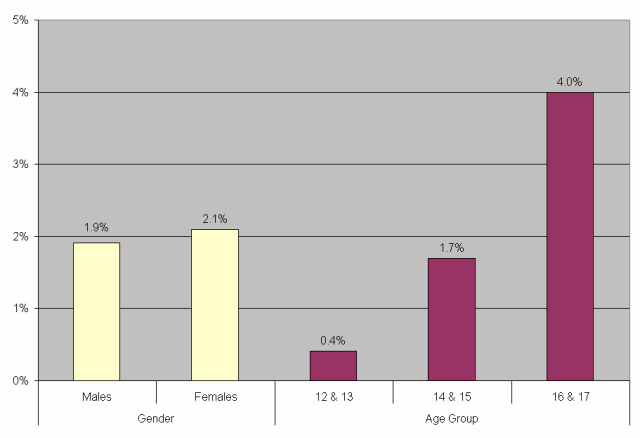
Cocaine Adolescent male and female Kentuckians are equally likely to use cocaine. Older adolescents are more likely to use cocaine than younger adolescents. Figure 5.3 presents the lifetime, past year, and past 30 day use rates for cocaine. Figure 5.4 presents the lifetime use rates for cocaine by age and gender. Table 5.3 presents the estimated number of adolescent Kentuckians who ever used cocaine. Figure 5.3: Lifetime, past year, and past 30 day cocaine use rates for adolescent Kentuckians (Survey question q46) Figure 5.4: Lifetime cocaine use rates for adolescent Kentuckians by age and gender (Survey question q45) Table 5.3: Estimated number of adolescent Kentuckians who ever used cocaine (Survey question q45)
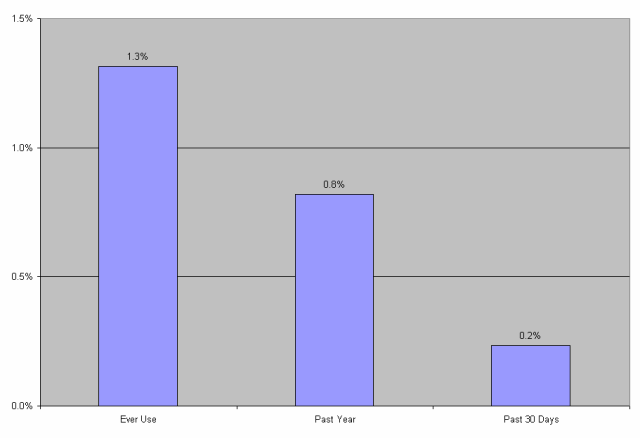
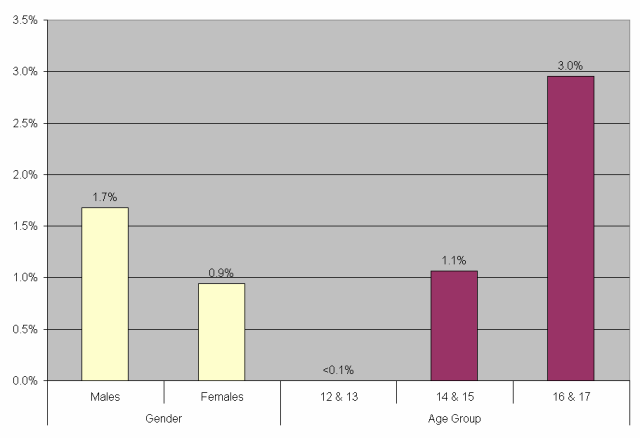
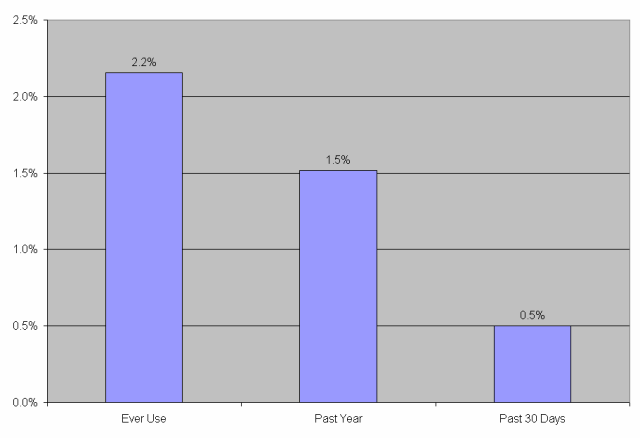
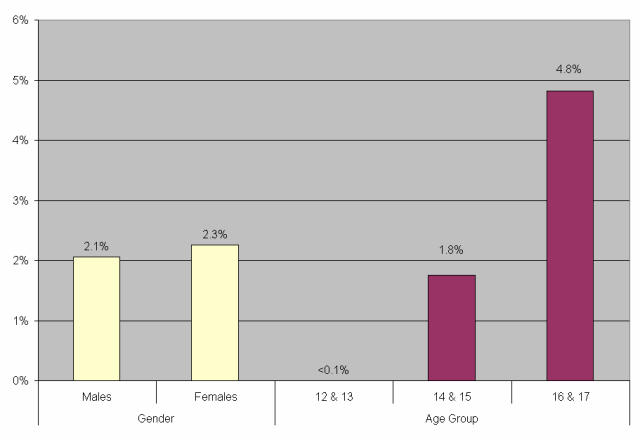
Other Stimulants Other stimulants include amphetamine, methamphetamine, and any other stimulants other than cocaine. Adolescent male and female Kentuckians are about equally likely to use other stimulants. Older adolescents are more likely to use other stimulants than younger adolescents. Figure 5.5 presents the lifetime, past year, and past 30 day use rates for other stimulants. Figure 5.6 presents the lifetime use rates for other stimulants by age and gender. Table 5.4 presents the estimated number of adolescent Kentuckians who ever used other stimulants. Figure 5.5: Lifetime, past year, and past 30 day other stimulant use rates for adolescent Kentuckians (Survey question q48) Figure 5.6: Lifetime other stimulant use rates for adolescent Kentuckians by age and gender (Survey question q47) Table 5.4: Estimated number of adolescent Kentuckians who ever used other stimulants (Survey question q47)
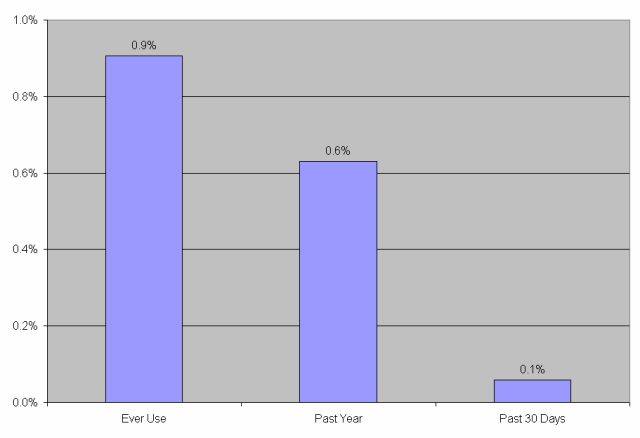
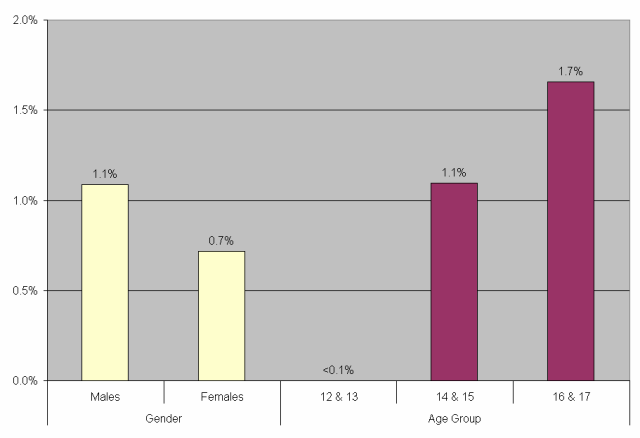
Oxycodone Adolescent male Kentuckians are slightly more likely to use oxycodone than females. Older adolescents are more likely to use oxycodone than younger adolescents. Figure 5.7 presents the lifetime, past year, and past 30 day use rates for oxycodone. Figure 5.8 presents the lifetime use rates for oxycodone by age and gender. Table 5.5 presents the estimated number of adolescent Kentuckians who ever used oxycodone. Figure 5.7: Lifetime, past year, and past 30 day oxycodone use rates for adolescent Kentuckians (Survey question q53) Figure 5.8: Lifetime oxycodone use rates for adolescent Kentuckians by age and gender (Survey question q52) Table 5.5: Estimated number of adolescent Kentuckians who ever used oxycodone (Survey question q52)
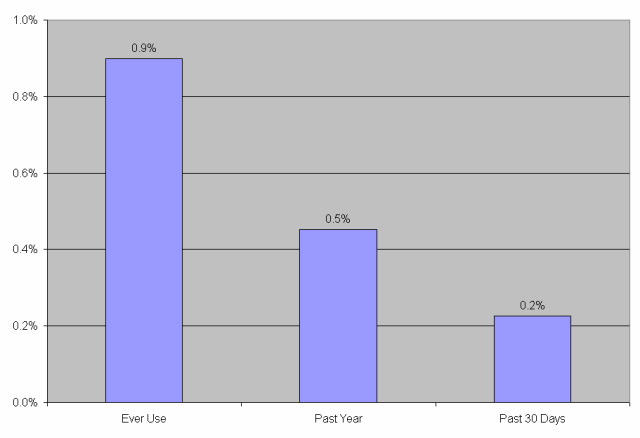
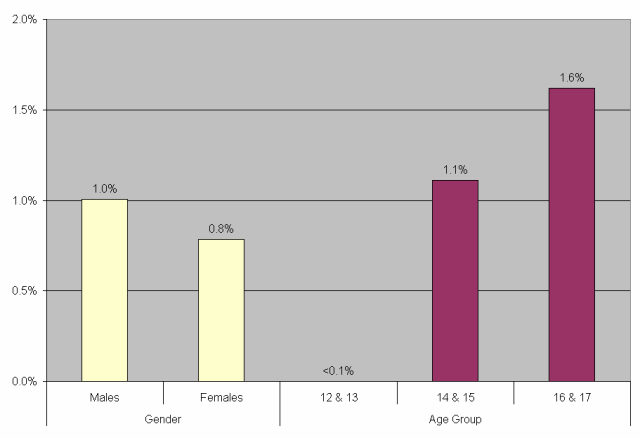
Other Opiates Opiates includes all opiates other than oxycodone which is presented on pages 46 and 47. Males are slightly more likely to use other opiates than females. Older adolescents are more likely to use other opiates than younger adolescents. Figure 5.9 presents the lifetime, past year, and past 30 day use rates for other opiates. Figure 5.10 presents the lifetime use rates for other opiates by age and gender. Table 5.6 presents the estimated number of adolescent Kentuckians who ever used other opiates. Figure 5.9: Lifetime, past year, and past 30 day other opiate use rates for adolescent Kentuckians (Survey question q51) Figure 5.10: Lifetime other opiate use rates for adolescent Kentuckians by age and gender (Survey question q50) Table 5.6: Estimated number of adolescent Kentuckians who ever used other opiates (Survey question q50)
Sedatives Adolescent female Kentuckians are slightly more likely to use sedatives than males. Older adolescents are more likely to use sedatives than younger adolescents. Figure 5.11 presents the lifetime, past year, and past 30 day use rates for sedatives. Figure 5.12 presents the lifetime use rates for sedatives by age and gender. Table 5.7 presents the estimated number of adolescent Kentuckians who ever used sedatives. Figure 5.11: Lifetime, past year, and past 30 day sedative use rates for adolescent Kentuckians (Survey question q55) Figure 5.12: Lifetime sedative use rates for adolescent Kentuckians by age and gender (Survey question q54) Table 5.7: Estimated number of adolescent Kentuckians who ever used sedatives (Survey question q54)
Hallucinogens Adolescent male Kentuckians are more likely to use hallucinogens than females. Older adolescents are more likely to use hallucinogens than younger adolescents. Figure 5.13 presents the lifetime, past year, and past 30 day use rates for hallucinogens. Figure 5.14 presents the lifetime use rates for hallucinogens by age and gender. Table 5.8 presents the estimated number of adolescent Kentuckians who ever used hallucinogens. Figure 5.13: Lifetime, past year, and past 30 day hallucinogen use rates for adolescent Kentuckians (Survey question q40) Figure 5.14: Lifetime hallucinogen use rates for adolescent Kentuckians by age and gender (Survey question q39) Table 5.8: Estimated number of adolescent Kentuckians who ever used hallucinogens (Survey question q39)
Club Drugs Club Drugs include MDMA, MDA, and other drugs common to rave parties. Adolescent male Kentuckians are more likely to use club drugs than females. Older adolescents are more likely to use club drugs than younger adolescents. Figure 5.15 presents the lifetime, past year, and past 30 day use rates for club drugs. Figure 5.16 presents the lifetime use rates for club drugs by age and gender. Table 5.9 presents the estimated number of adolescent Kentuckians who ever used club drugs. Figure 5.15: Lifetime, past year, and past 30 day club drug use rates for adolescent Kentuckians (Survey question q42) Figure 5.16: Lifetime club drug use rates for adolescent Kentuckians by age and gender (Survey question q41) Table 5.9: Estimated number of adolescent Kentuckians who ever used club drugs (Survey question q41)
Inhalants Adolescent male Kentuckians are more likely to use inhalants than females. Older adolescents are more likely than younger adolescents to use inhalants. Figure 5.17 presents the lifetime, past year, and past 30 day use rates for inhalants. Figure 5.18 presents the lifetime use rates for inhalants by age and gender. Table 5.10 presents the estimated number of adolescent Kentuckians who ever used inhalants. Figure 5.17: Lifetime, past year, and past 30 day inhalant use rates for adolescent Kentuckians (Survey question q44) Figure 5.18: Lifetime inhalant use rates for adolescent Kentuckians by age and gender (Survey question q43) Table 5.10: Estimated number of adolescent Kentuckians who ever used inhalants (Survey question q43)
Other Drugs Other drugs include any substance used to become intoxicated other than those previously discussed in this section. Most of the drugs used to intoxication are over-the-counter cold and cough remedies. Adolescent female Kentuckians are more likely than males to use these other drugs. Older adolescents are more likely to use other drugs than younger adolescents. Figure 5.19 presents the lifetime, past year, and past 30 day use rates for other drugs. Figure 5.20 presents the lifetime use rates for other drugs by age and gender. Table 5.11 presents the estimated number of adolescent Kentuckians who ever used other drugs. Figure 5.19: Lifetime, past year, and past 30 day other drug use rates for adolescent Kentuckians (Survey question q59) Figure 5.20: Lifetime other drug use rates for adolescent Kentuckians by age and gender (Survey question q56) Table 5.11: Estimated number of adolescent Kentuckians who ever used other drugs (Survey question q56)
Any Illicit Drug Illicit drugs include all substances previously discussed in this section but excludes alcohol and nicotine. Adolescent male Kentuckians are more likely than females to use illicit drugs. Older adolescents are more likely to use illicit drugs than younger adolescents. Figure 5.21 presents lifetime, past year, and past 30 day use rates for illicit drugs. Figure 5.22 presents lifetime use rates for illicit drugs by age and gender. Table 5.12 presents the estimated number of adolescent Kentuckians who ever used illicit drugs. Figure 5.21: Lifetime, past year, and past 30 day illicit drug use rates for adolescent Kentuckians (Survey questions q37-q63) Figure 5.22: Lifetime illicit drug use rates for adolescent Kentuckians by age and gender (Survey questions q37-q63) |
2005 Report Section Quick Links
Executive Summary * Purpose, Objectives, & Methods * Demographics * Nicotine * Alcohol
Drugs * DSM-IV-TR Criteria * Treatment Utilization and Treatment Need *Attitudes & Beliefs
1998 Report Comparison * Regional Comparison * Concluding Remarks