 |
||
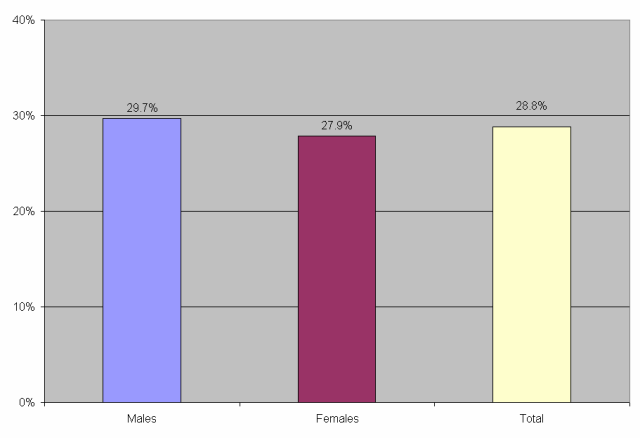
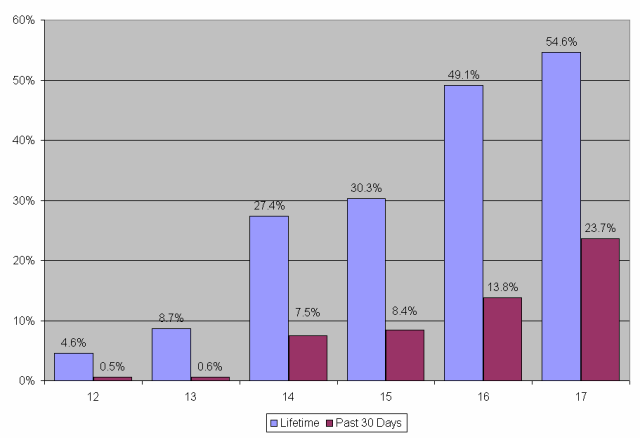
Section 4. AlcoholAdolescent male Kentuckians were more likely to ever drink than adolescent female Kentuckians. Figure 4.1 presents the percent of adolescents who use alcohol by gender. Older adolescents are more likely to drink than younger adolescents. Figure 4.2 presents the lifetime and past 30 day use rates for adolescent alcohol use. Table 4.1 presents the estimated number of adolescent Kentuckians who drank alcohol in their lifetime, in the past year, and the past 30 days. Figure 4.1: Lifetime alcohol use for adolescent Kentuckians by gender (Survey question q35) Figure 4.2: Prevalence of alcohol use for adolescent Kentuckians by age (Survey question q35) Table 4.1: Estimated number of adolescent Kentuckians who used alcohol in their lifetime, within the past year, and within the past 30 days (Survey question q36)
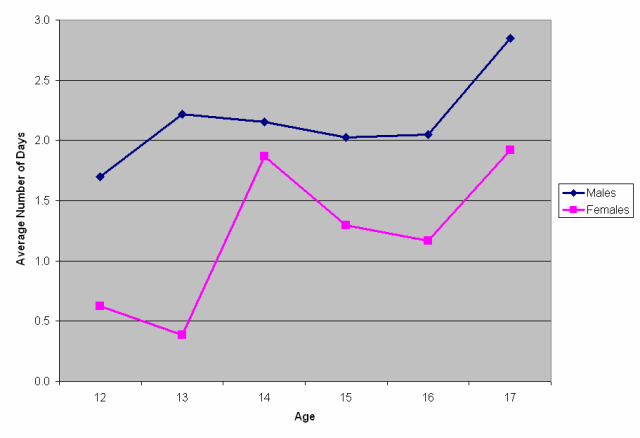
Of those adolescent Kentuckians who drank within the past month, males drank more days per month than females. Table 4.2 presents the average number of days per month of alcohol use by gender. Figure 4.3 presents the average number of days per month of alcohol use by age and gender for those adolescents who drank in the past month. Males were more likely to ever binge on alcohol than females. A binge episode is defined as five or more drinks in one setting for males, four or more for females. Table 4.3 presents the percent and estimated number of adolescent Kentuckians who ever binged. Table 4.2: Average number of days per month of alcohol use for adolescent Kentuckians who drank within the past month by gender (Survey question q68)
Figure 4.3: Average number of days per month of alcohol use for adolescent Kentuckians who drank within the past month by age and gender (Survey question q68) Table 4.3: Percent and estimated number of adolescent Kentuckians who ever drank and binged on alcohol at least once (Survey questions q66, q67)
|
2005 Report Section Quick Links
Executive Summary * Purpose, Objectives, & Methods * Demographics * Nicotine * Alcohol
Drugs * DSM-IV-TR Criteria * Treatment Utilization and Treatment Need *Attitudes & Beliefs
1998 Report Comparison * Regional Comparison * Concluding Remarks